

Think big-ticket gadgets run ecommerce? Think again.
Trending ecommerce products in 2026 are small, problem-solving items, like wellness tech, home convenience, beauty devices and impulse buys driven by social video.
They matter because shoppers want quick wins at $15 to $100, buy fast from TikTok virality or convert over time on Shopify and Amazon, and that pattern shapes inventory, margins, and ad creative.
If you sell, prioritize products that solve a clear pain, photograph and demo on video, and test short-form ads while measuring CAC and conversion on your top 20 SKUs.
Current High‑Demand Ecommerce Products Overview
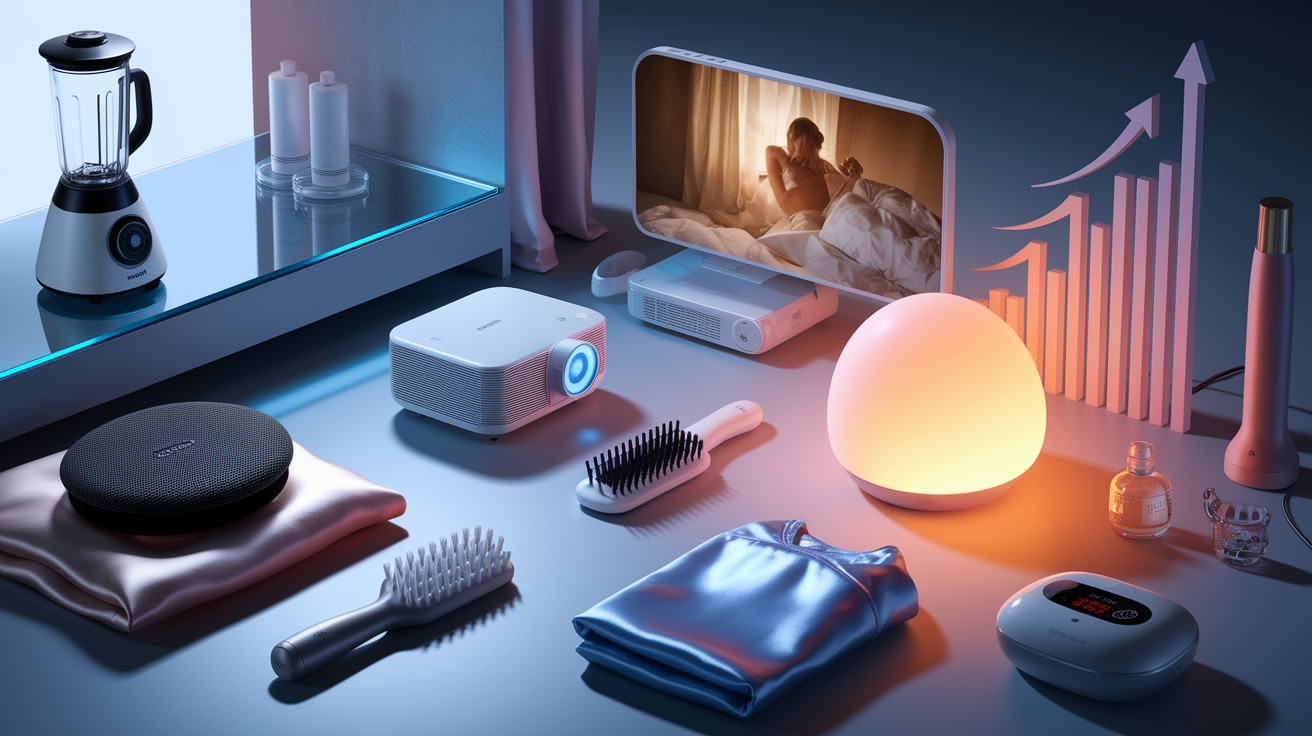
Sales data from 2024 into early 2025 points to wellness tech, home convenience, and beauty devices as the categories pulling the most weight. Portable blenders and mini projectors are both sitting at 30,000 to 50,000 monthly searches on Amazon. Blenders average $28 to $45 and appeal mostly to health-focused millennials and Gen Z. Mini projectors cost more (think $80 to $200) and attract remote workers, college students, and people setting up home entertainment spaces. Athleisure still dominates clothing searches. Oversized fits and matching sets combine comfort with street style in a way that resonates.
TikTok Shop became a launch pad for impulse buys. Heatless curlers jumped past 80,000 monthly searches after a wave of tutorial videos. They retail between $10 and $25 and sell primarily to women aged 18 to 34. LED ambient lighting, especially gradient sunset lamps and smart bulbs, saw a 22 percent jump in Q4 2024 compared to the year before. Price points range from $15 to $60. Pet grooming tools like self-cleaning slicker brushes and electric nail grinders move 15,000 to 25,000 units per month across major platforms, appealing to pet owners willing to spend $20 to $40 for at-home grooming.
Sleep-aid devices represent another high-growth segment. White-noise machines, smart sleep masks, and aromatherapy diffusers collectively pull more than 60,000 monthly searches. Individual products price between $25 and $100. Shopify stores report strong subscription attachment rates for consumables like essential oils and replacement filters. What ties these categories together is a blend of problem-solving utility, social-media visibility, and price points that fit discretionary budgets.
Top 8 trending products by monthly search volume and audience:
- Portable blender (30,000 to 50,000 searches per month, $28 to $45, health-focused millennials and Gen Z)
- Mini projector (30,000 to 40,000 searches per month, $80 to $200, remote workers, students, home entertainment fans)
- Heatless curlers (70,000 to 80,000 searches per month, $10 to $25, women 18 to 34)
- LED ambient lighting (35,000 to 50,000 searches per month, $15 to $60, home decorators, gamers, Gen Z)
- Pet grooming tools (20,000 to 30,000 searches per month, $20 to $40, pet owners seeking at-home convenience)
- Sleep-aid devices (60,000+ combined searches per month, $25 to $100, adults prioritizing wellness and sleep quality)
- Athleisure sets (40,000 to 60,000 searches per month, $30 to $70, fitness enthusiasts, casual-wear shoppers)
- Skincare devices like jade rollers and LED masks (25,000 to 40,000 searches per month, $15 to $150, skincare routines, beauty enthusiasts)
Most of these products address a clear pain point or lifestyle preference, photograph well for social content, and sit in the $15 to $100 range where buyers make quick decisions without lengthy research. Products that offer personalization like monogramming, color variants, or bundled accessories see conversion rates 10 to 15 percent higher than generic equivalents.
Category Breakdown of Trending Products
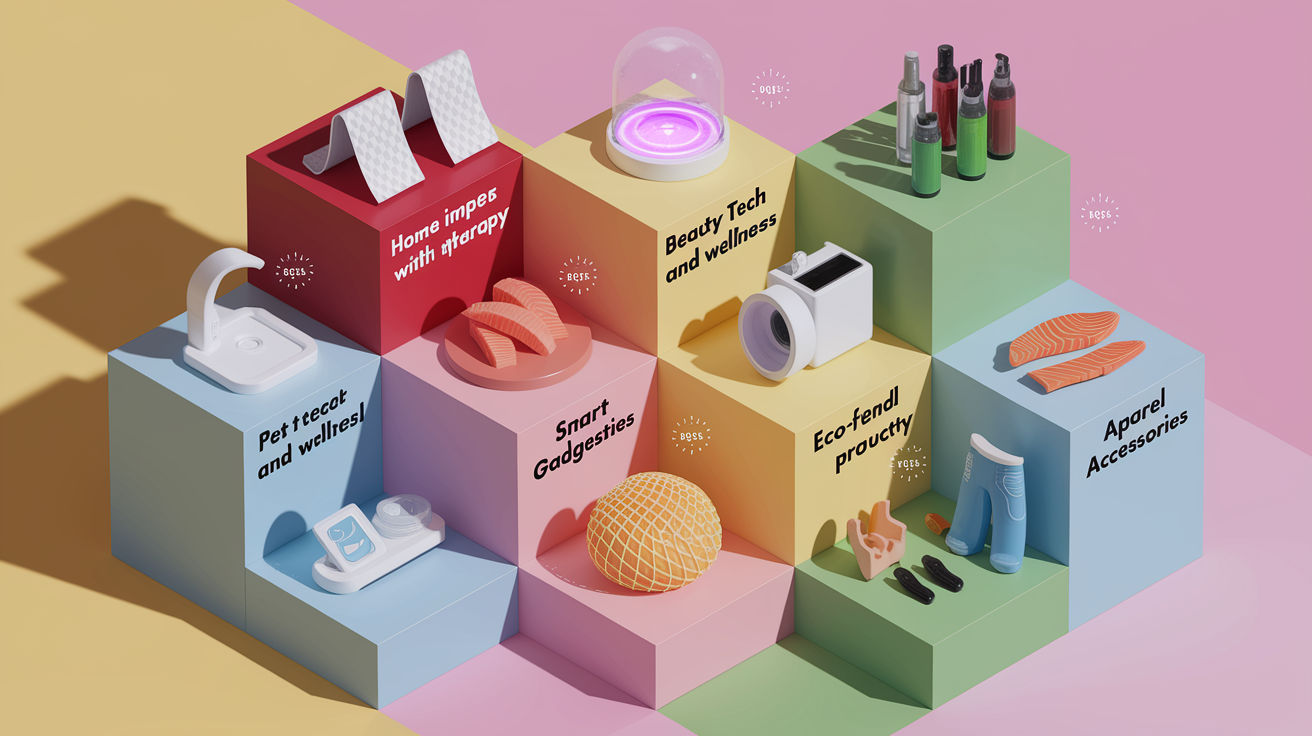
Six major product categories are driving most of the new ecommerce growth in 2024 and early 2025. Each category benefits from distinct consumer behavior shifts. Understanding these drivers helps you prioritize inventory and marketing spend.
Home improvement items, especially renter-friendly solutions, climbed 18 percent year-over-year. Peel-and-stick wallpaper now pulls 14,500 monthly searches, fueled by renters who want temporary personalization without losing security deposits. Filtered showerheads jumped 3,900 percent in five-year search growth, hitting 18,900 searches per month. One top-selling filter model moves more than 10,000 units monthly on Amazon at a $30 to $50 price point. Demand is strongest in the US, India, and New Zealand, where water quality concerns and skin-health awareness intersect.
Beauty tech and wellness devices represent the second high-growth category. Red-light therapy caps, microneedle patches, and under-eye patches all posted triple-digit search growth. Under-eye patches alone generate 62,200 monthly searches, with price points between $7 and $20. Microneedle patches (dissolving needles that deliver active ingredients deeper into skin) grew 1,175 percent over five years and now attract 6,000 searches per month. These products appeal to consumers who want clinical results at home, without the cost or appointment commitment of professional treatments.
Pet supplies remain evergreen but are shifting toward premium and functional subcategories. Salmon bites for dogs, often marketed as omega-3 joint supplements, climbed 313 percent in search interest and now average 12,400 searches monthly. One leading brand generates over $65,000 per month on Amazon by positioning salmon oil bites as both a treat and a wellness product. The category thrives because pet owners treat their animals as family members and willingly invest in specialized nutrition and grooming tools.
Smart gadgets and niche electronics grew 24 percent year-over-year, led by hall-effect joysticks and neckband speakers. Hall-effect joysticks (used in gaming controllers and industrial controls) surged 5,300 percent over five years, now pulling 21,900 monthly searches. Neckband speakers multiplied 99 times in search volume over the same period, reaching 800 searches per month. Both products solve specific problems: hall-effect sticks offer durability and precision, while neckband speakers provide immersive personal audio without isolating the wearer from their environment.
Eco-friendly products and sustainable alternatives are no longer niche. They’re expected baseline features. African net sponges (a sustainable exfoliation tool) jumped 2,700 percent in five-year search growth and now command 80,700 monthly searches. Scent beads for laundry, bamboo baby pajamas, and reusable drinkware all posted double or triple-digit percentage increases. Consumers increasingly filter product searches by “eco-friendly,” “biodegradable,” or “zero waste.” Sellers who surface those attributes in titles and descriptions see measurable conversion lifts.
Apparel accessories occupy the sixth category, with emphasis on comfort, aesthetic trends, and easy personalization. Barrel-fit jeans multiplied 99 times in search volume over five years, now averaging 1,000 searches per month in Germany, the Netherlands, the UK, and the US. Jelly bras (adhesive silicone bras designed for backless or strapless outfits) also saw 99X growth, reaching 23,000 monthly searches and heavy TikTok virality. Key-fob covers, a small aesthetic accessory, grew 110 percent and now pull 5,100 searches per month, driven by Gen Z’s preference for personalized everyday items.
Concrete product examples by category:
- Home improvement: Peel-and-stick wallpaper (14,500 searches per month), filtered showerheads (18,900 searches per month), tumble rugs that are machine-washable and spillproof (7,200 searches per month)
- Beauty tech and wellness: Under-eye patches (62,200 searches per month), microneedle patches (6,000 searches per month), red-light therapy caps (2,200 searches per month)
- Pet supplies: Salmon bites for dogs (12,400 searches per month), weighted sleep sacks for infants (9,700 searches per month)
- Smart gadgets: Hall-effect joysticks (21,900 searches per month), neckband speakers (800 searches per month)
- Eco-friendly: African net sponges (80,700 searches per month), bamboo baby pajamas (4,200 searches per month), scent beads (7,000 searches per month)
- Apparel accessories: Barrel-fit jeans (1,000 searches per month), jelly bras (23,000 searches per month), key-fob covers (5,100 searches per month)
Platform‑Specific Trend Insights
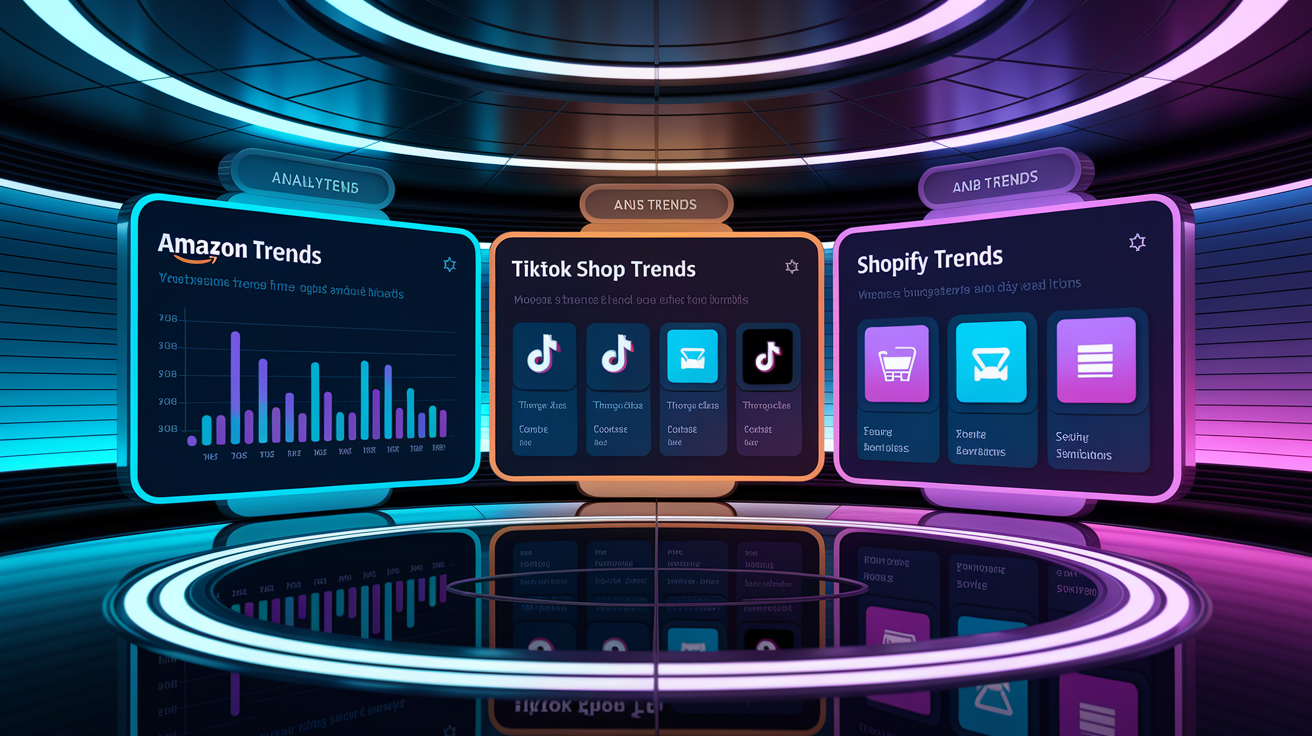
Trending products behave differently depending on the platform where they’re sold. Amazon rewards high search volume and repeat purchases, TikTok Shop converts on virality and impulse, and Shopify thrives on customization and subscription models. Understanding these distinctions helps you choose the right channel and tailor your product presentation.
Platform choice also dictates pricing strategy and fulfillment expectations. Amazon buyers compare multiple listings in a single session and expect fast Prime shipping. TikTok Shop users often discover products mid-scroll and convert within minutes if the creative is compelling. Shopify customers tolerate longer shipping windows when they perceive the product as unique or personalized.
Amazon Trends
Amazon’s Movers & Shakers list updates hourly, surfacing products with sudden sales spikes. Fitness accessories and kitchen gadgets consistently dominate this feed. Resistance bands, yoga mats, and foam rollers see predictable January surges, but high-performing listings maintain year-round velocity by bundling accessories like carry bags, instructional PDFs, or bonus resistance loops. Kitchen gadgets like portable blenders and electric milk frothers occupy the $25 to $50 range and benefit from high review counts. Listings with 1,000+ reviews convert 30 to 40 percent better than those with fewer than 100.
Frequent replenishment items like coffee pods, vitamins, skincare serums, and pet treats generate the highest lifetime value on Amazon. Creatine gummies jumped 5,300 percent in five-year search growth and now pull 110,700 monthly searches. One top seller moves thousands of units per month by emphasizing convenience and taste over traditional powder formats. Turmeric gummies and beet gummies follow similar patterns, each adding 600 to 1,700 percent search growth and appealing to buyers who want supplement benefits without swallowing pills.
Price-competitive categories on Amazon require tight cost control. Toe spacers, priced between $1 and $25, accumulated over 2.5 billion TikTok views and now generate 40,900 monthly searches. Sellers succeed by offering multi-packs, bundling with instructional videos, and running Subscribe & Save discounts. The goal is to win the buy box at the lowest possible cost per acquisition, then upsell related products through Amazon’s “frequently bought together” algorithm.
TikTok Shop Trends
Virality on TikTok drives sales spikes that can move thousands of units in 48 to 72 hours. Heatless curlers, under-eye patches, and hair-wax sticks all exploded after tutorial videos hit millions of views. Under-eye patches earned 225,000+ likes on a single September 2025 post, and search volume jumped to 62,200 per month shortly after. Hair-wax sticks have sustained 49,700 monthly searches since viral adoption in 2022, with price points between $5 and $20.
Impulse buying dominates TikTok Shop behavior. Buyers see a product in use, watch a 15-second demo, and check out without leaving the app. This means creative quality (lighting, before-and-after clarity, and authentic testimonials) matters more than traditional product photography. Jelly bras, African net sponges, and blooming gel for nails all benefited from user-generated content that showed immediate, visible results.
Beauty and wellness products perform especially well because they solve visible problems and photograph clearly. Lash shampoo grew 850 percent over five years and now pulls 12,700 monthly searches, priced between $5 and $15. Rice-water shampoo climbed 285 percent, hitting 8,700 searches per month, largely due to TikTok videos highlighting its thousand-year heritage and hair-growth claims. Peptide lip balm saw 99X search growth, reaching 3,000 monthly searches. Top sellers on Amazon generate $120,000 per month from roughly 7,800 units sold, with average order values around $15 to $30.
Shopify Trends
Shopify stores excel when they focus on niche audiences and offer customization that mass marketplaces can’t match easily. Embroidered apparel like hoodies, beanies, and trucker caps grew sharply: embroidered sweaters up 77 percent year-over-year, embroidered jackets and vests up 55 percent, embroidered trucker caps up 73 percent. Print-on-demand catalogs now offer 169 embroidery-ready products, and merchants use mockup generators to show personalized previews before production.
Subscription models convert exceptionally well on Shopify. Hojicha latte mixes, probiotic sodas, and adaptogen drinks all posted triple-digit search growth and align with recurring-order economics. Hojicha latte searches jumped 773 percent to 34,000 per month, with a projected market expansion of $2.1 billion by 2033. Probiotic soda climbed 1,567 percent, reaching 11,300 searches monthly, and sells in multipacks priced between $5 and $30. These products attract wellness-focused buyers willing to commit to monthly shipments in exchange for convenience and slight discounts.
Higher-margin personalized items like wall art, blankets, and drinkware thrive on Shopify because buyers expect to pay a premium for customization. Wall art is one of the highest-margin print-on-demand categories, with low production costs and retail prices that can exceed $50 for a single framed print. Personalized blankets saw 12 percent demand growth. Bundling a blanket with matching cushion covers raises average order value by 20 to 30 percent. Reusable drinkware, including stainless-steel bottles and glass can-shaped bottles, grew 25 percent, supported by the $10.05 billion reusable-bottle market in 2023, projected to reach $15.61 billion by 2032.
Seasonality and Product Lifecycle Considerations
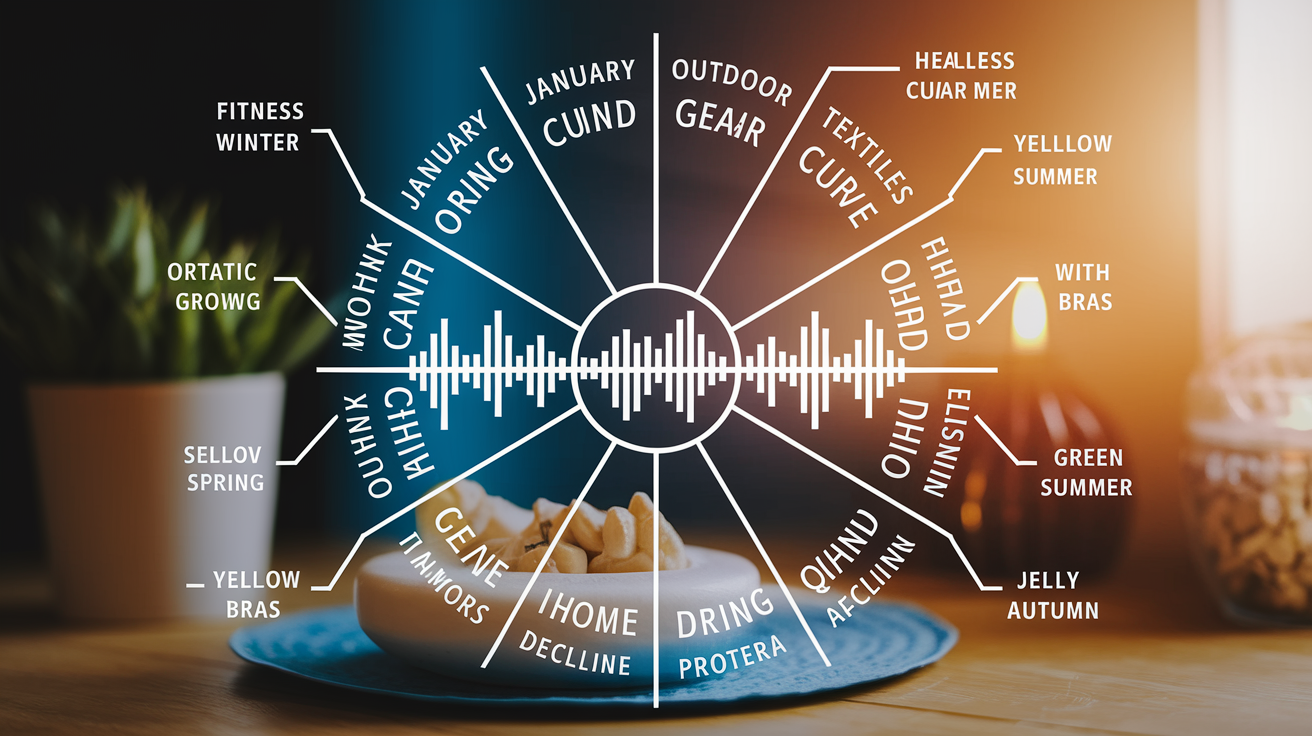
Trending products rarely maintain peak velocity year-round. Seasonal demand curves and viral lifecycles determine how long a product remains profitable and when to rotate inventory or shift marketing spend.
Fitness gear reliably spikes in January, driven by New Year’s resolutions and gym memberships. Resistance bands, yoga mats, dumbbells, and foam rollers see search volume increases of 30 to 50 percent between late December and mid-February. Outdoor items like portable grills, camping gear, and hydration packs peak in late spring and summer. April through July represents 60 to 70 percent of annual sales for many SKUs. Home décor and seasonal textiles surge in Q4: flannel sheets trend every fall, puffer jackets jumped 819 percent in September 2025 compared to September 2024, and candles see quarterly design rotations to match holidays and seasonal aesthetics.
Viral products often follow a compressed lifecycle: rapid 30 to 90 day growth, a plateau, then decline unless the product is repositioned or bundled. Heatless curlers, toe spacers, and jelly bras all experienced explosive TikTok-driven growth followed by stabilization at elevated baseline search volumes. Smart sellers capture early momentum by running paid ads during the viral window, then transition to organic content and email remarketing to extend the tail. Bundling viral items with complementary products (selling heatless curlers alongside silk pillowcases, or toe spacers with foot-care balms) helps maintain margins after the initial surge fades.
Seasonal peaks and typical duration by product category:
- Fitness gear sees a January surge that lasts 6 to 8 weeks, then returns to 60 to 70% of peak through spring
- Outdoor and camping peaks April to July and represents 60 to 70% of annual revenue for most outdoor SKUs
- Home décor and textiles peak in Q4 (September to December). Flannel sheets, blankets, and candles rotate designs quarterly
- Beauty and skincare is evergreen with a minor Q4 lift for gifting. Viral items peak within 30 to 90 days of content surge
- Back-to-school runs late July to early September and includes backpacks, tech accessories, and dorm organization
How to Identify Future Trending Products

Spotting products before they peak requires monitoring early signals across search, social, and sales platforms. Sellers who track these indicators can source inventory, design creatives, and launch ads while competition is still low and cost-per-click remains affordable.
Google Trends remains the most reliable free tool for validating sustained interest. A product that shows steady or rising search volume over 12 to 24 months indicates real demand rather than a one-time spike. Creatine gummies climbed from near-zero searches in 2020 to 110,700 monthly searches by 2025. That’s a clear multi-year growth trajectory. Contrast that with fad products that spike for 4 to 6 weeks then return to baseline. Those can still be profitable if you enter early, but they require faster execution and tighter inventory control.
TikTok Creative Center provides view counts, engagement rates, and trending hashtags for products gaining traction. When a hashtag like #tospacers accumulates 2.5 billion views, or a single under-eye patch video earns 225,000 likes, those are strong early signals. Cross-reference TikTok virality with Amazon’s Movers & Shakers list. If a product ranks in the top 100 movers and also appears in multiple high-engagement TikTok videos within the same week, it’s likely entering a growth phase. Amazon Movers & Shakers updates hourly, so checking it twice daily can reveal products climbing fast before they hit mainstream awareness.
Shopify dashboard insights and app-ecosystem data offer another layer. Apps that aggregate anonymized sales data across thousands of stores can surface products with sudden order-volume increases. If a niche item like mandelic acid deodorant or pistachio perfume begins appearing in dozens of new stores simultaneously, that clustering suggests suppliers are pitching it, early adopters are testing it, and demand is building. Print-on-demand platforms often highlight bestseller badges or “trending design” tags. Those products have already demonstrated conversion traction, reducing your validation risk.
Five early-indicator signals to monitor:
- Rising search volume over 6 to 12 months (Google Trends) indicates sustained rather than one-off interest
- Cross-platform consistency: product appears simultaneously on TikTok viral lists, Amazon Movers & Shakers, and Google search increases
- Supplier activity: multiple wholesalers or dropshipping catalogs begin listing the same product within a short window
- Engagement velocity on short-form video: view counts in the millions, comment sections asking “where to buy,” and creator reposts
- Search term expansion: related keywords and long-tail variations (e.g., “hall effect joystick,” “hall effect switch,” “hall effect gaming controller”) all grow in parallel, signaling category-wide momentum rather than a single viral post
Final Words
In the action, we mapped the hottest items (portable blenders, mini projectors, athleisure, LED lighting, beauty tools) and why they’re rising across Amazon, TikTok Shop, and Shopify.
We broke trends into category drivers, covered seasonality and lifecycle risk, and showed platform differences—Amazon = search/replenishment, TikTok = fast virality, Shopify = subscriptions and higher margins. We also listed tools and early signals to watch.
Use one of those signals to test a small SKU this week. Trend hunting pays off—trending ecommerce products still offer real upside.
FAQ
Q: What e-commerce products sell the most and which are in high demand right now?
A: The e-commerce products that sell the most and are in high demand right now are portable blenders, mini projectors, athleisure, LED ambient lighting, pet grooming tools, sleep‑aid devices, beauty gadgets, and subscription consumables—high search and viral traction.
Q: What are the latest e-commerce trends?
A: The latest e-commerce trends are short‑video virality (TikTok), subscription consumables, personalization, beauty tech, eco‑friendly home goods, athleisure, and rapid testing on Amazon and Shopify to spot winners fast.
Q: What are the 7 C’s of e-commerce?
A: The 7 C’s of e-commerce are content, commerce, customization, convenience, community, communication, and connection — the core elements for discovery, purchase flow, retention, and support.