


Picking a BNPL partner by its headline fee is a costly mistake.
What matters is net margin after fees versus the real conversion and AOV lift the option delivers.
Run a model with your actual conversion, AOV, product gross margin, monthly visitors, and return rate to compare providers on net profit per order.
Also watch fixed fees, settlement timing, acceptance rates, and who absorbs chargeback or default risk—those eat margin fast.
Thesis: choose the provider that maximizes net profit per order after realistic lifts, not the lowest percentage.
Quick Answer: Selecting the Most Profitable BNPL Partner
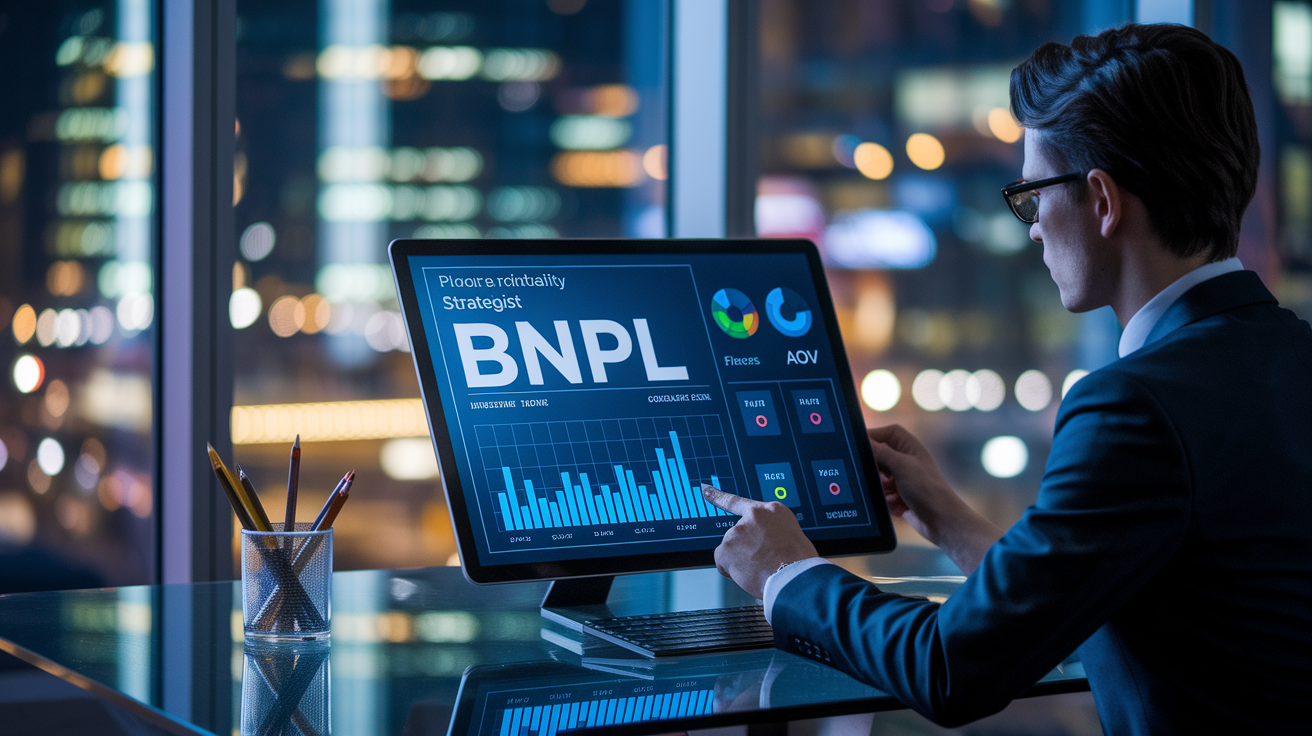
Profitability in BNPL comes down to net margin after fees versus incremental revenue from conversion uplift and bigger baskets. A provider charging 2% that delivers 5% conversion lift beats one charging 4% with 3% lift, assuming your AOV and margins hold. The fastest way to evaluate a partner is to model five core variables using your actual traffic, baseline conversion, and product margins.
You’ll need these numbers: current conversion rate, average order value, product gross margin percentage, monthly visitor count, and typical return rate. Run a quick scenario for each provider using their quoted fee, expected conversion uplift (industry average hovers around 9%), AOV lift (usually 10 to 20%), and settlement timing. Whichever provider delivers the highest net profit per order after deducting percentage fee, fixed fee, and operational costs wins.
Key profitability criteria:
Fee rate – Percentage fee plus fixed per transaction. Lower only matters if everything else stays constant.
Acceptance rate – Higher approval rates mean more completed transactions and less cart abandonment at checkout.
Repayment risk allocation – Who absorbs default and chargeback risk. Provider absorbed risk makes your net margin more predictable.
Average order value uplift – Look for documented basket size increases. Expect 10 to 30% gains in typical cases.
Settlement timing – Immediate funding preserves working capital. Net 30 or net 60 increases float and slows margin velocity.
Make a rapid preliminary choice by requesting fee schedules and sample contracts from three providers. Plug each into a margin calculator with conservative 5% conversion lift and 15% AOV increase. Select whichever yields the highest net profit per thousand orders. If the difference is less than 10%, integration complexity and chargeback liability break the tie. Don’t go deeper until you’ve got live pilot data.
Understanding BNPL Fee Structures
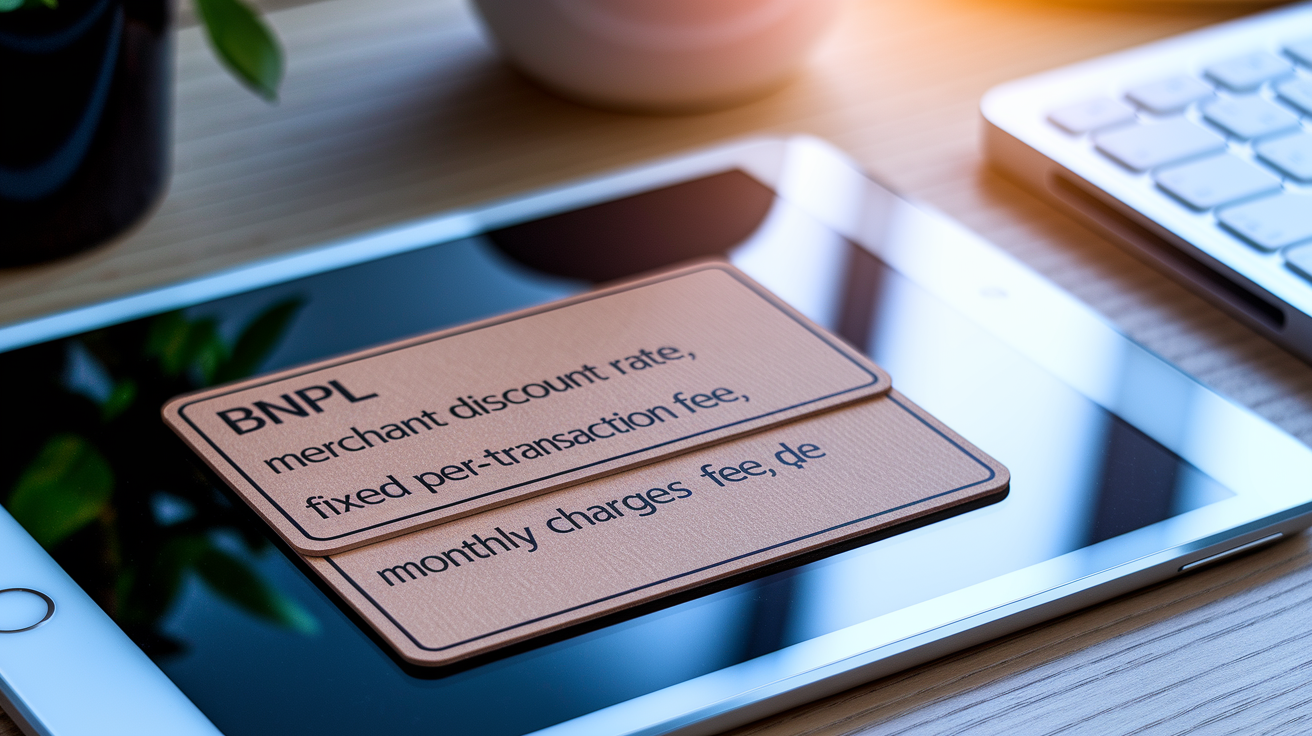
BNPL fees typically stack three layers: a percentage merchant discount rate (MDR), a fixed per transaction fee, and sometimes monthly platform or gateway charges. The percentage fee applies to the transaction value. Common ranges run 2.0% to 6.0% in 2025, with the midpoint around 3.5 to 4.5% for mid market merchants. The fixed fee sits on top, usually $0.10 to $0.50 per order, and hits harder on lower AOV merchants. For example, a $0.49 fixed fee on a $50 order adds another 0.98% in effective cost. On a $200 order it drops to 0.25%.
Some providers add monthly minimums or platform subscription fees ranging from zero to $500+ per month, depending on feature set and integration tier. Volume tiered pricing is common. Merchants processing over $100,000 monthly GMV often negotiate fees down to the 2 to 3% range, while smaller stores pay closer to 5 to 6%. A few providers use hybrid models that blend a lower percentage with higher fixed fees, which favors high AOV businesses. Tiered structures mean your effective rate improves as you scale. But scaling without profitability at your current tier is a trap.
Different pricing models hit merchant types unevenly. Small merchants with AOVs under $75 get squeezed by fixed fees and upper tier percentage rates, often seeing total effective fees above 6.5% per transaction. Large merchants selling goods with $200+ AOVs and negotiating volume discounts can hit blended rates around 2.5 to 3.5%. Direct API integrations typically cost less than plugin routes because the provider avoids middleware revenue shares. Some merchants report saving 0.5 to 1.0 percentage points by going direct.
Common fee variations:
Flat percentage only – Simplest model. Rare at scale but common in enterprise contracts.
Percentage + fixed fee – Most typical. Fee structure looks like “4.99% + $0.49 per transaction.”
Tiered volume pricing – Percentage fee steps down at $50k, $100k, $250k monthly thresholds.
Hybrid subscription + transaction – Monthly platform fee plus lower per transaction rate. Works for high volume merchants with predictable traffic.
Identifying Hidden Costs and Operational Risks
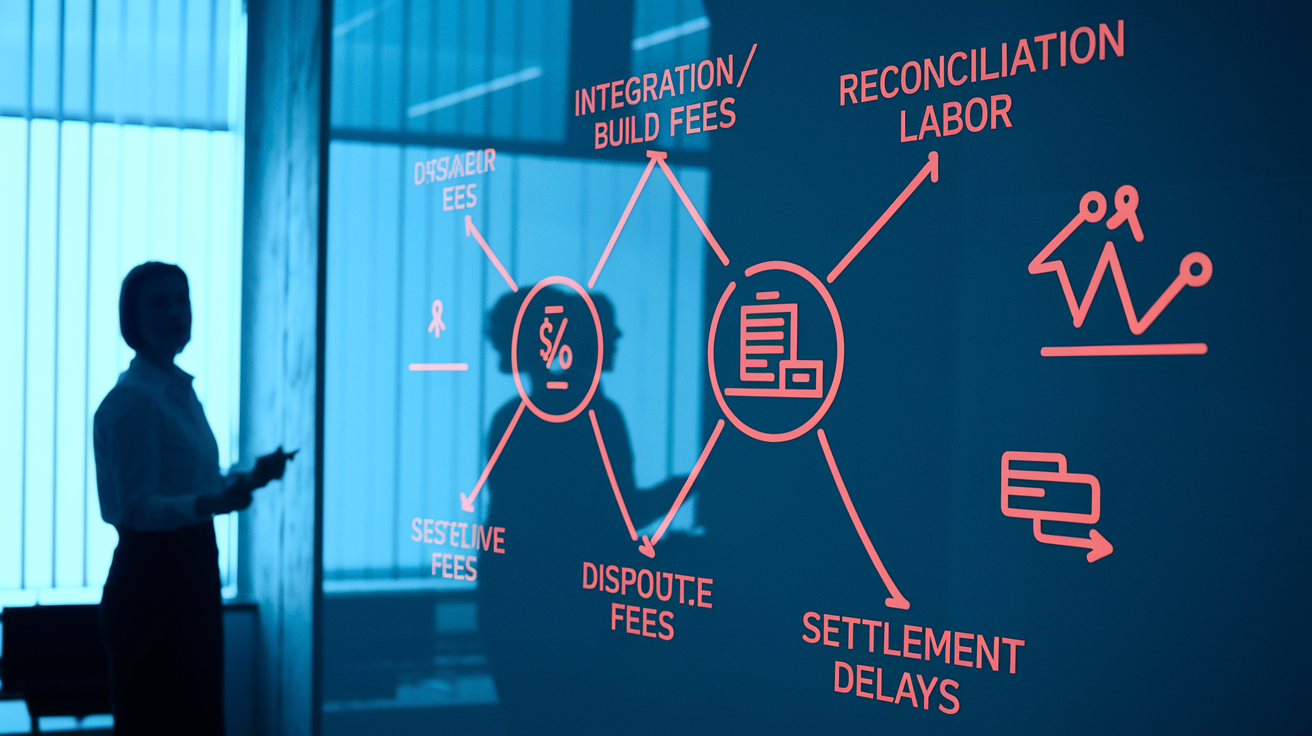
Beyond headline fees, BNPL providers impose integration costs, reconciliation overhead, dispute fees, and settlement delays that erode margin if you don’t track them. One time integration and build expenses range from zero (for plug and play plugins) to $15,000 for custom API builds. Mid market merchants typically spend $1,000 to $7,500. Monthly reconciliation labor averages 2 to 10 hours initially because BNPL settlements often arrive separately from card payments and require matching refunds, partial captures, and fee adjustments across platforms. Dispute and chargeback fees run $15 to $25 per case, plus the lost sale revenue and COGS exposure if liability sits with you.
Settlement timing creates a working capital drag. Providers offering net 30 or net 60 funding require you to float inventory cost and fulfillment expense until the BNPL payment clears. For $100,000 monthly BNPL volume with net 30 terms, you need roughly $100k in extra working capital versus immediate settlement. Cross border and FX fees add 0.5 to 3.0% when selling internationally through a BNPL provider, especially if the provider converts currency before remitting funds. Return handling costs rise because BNPL purchases show 15 to 20% higher return rates. Each return triggers fee adjustments, restocking, and customer service overhead that compounds operational expense.
| Hidden Cost Type | Impact on Merchant Margin |
|---|---|
| Integration/build fees | $0 to $15k one time; amortize over 12 to 24 months or roughly 0.1 to 0.5% per order in year one |
| Reconciliation labor | 2 to 10 hours/month; around $100 to $500 monthly cost if outsourced or internal FTE time |
| Chargeback/dispute fees | $15 to $25 per case + COGS loss; at 0.5% dispute rate, adds roughly 0.1 to 0.2% to effective fee |
| Settlement delay | Working capital cost = monthly volume × funding lag days ÷ 30; e.g., $100k at net 30 = $100k tied up |
| FX and cross border fees | 0.5 to 3.0% of international volume; invisible until first settlement report |
Risk exposures extend to chargeback liability allocation, fraud screening gaps, and reporting limitations. If the provider shifts fraud and default risk to you, budget an annual dispute cost equal to your estimated dispute rate (0.1 to 1.5% of volume depending on vertical) multiplied by average order value and transaction count, plus per dispute fees. Some providers cap reporting at 90 days, forcing you to store transaction logs externally for accounting audits. When contracts include revenue share clauses on marketing co promotion or data licensing, those percentages stack on top of transaction fees and reduce effective margin by another 0.2 to 1.0%.
Calculating Margin Impact and ROI

Margin impact starts with per order net profit before and after BNPL fees, then scales to portfolio level using projected volume and uplift assumptions. The baseline formula is: Net profit per order = Sale price, COGS, (Sale price × BNPL percentage fee), Fixed BNPL fee, expected chargeback and return impact. If your product sells for $100 with $60 COGS (40% gross margin), and the BNPL fee is 3.0% + $0.30, the fee costs $3.30, dropping gross profit from $40 to $36.70. That’s a 3.3 percentage point margin decline and an 8.25% reduction in absolute profit per order.
The ROI calculation layers in conversion lift, AOV increase, and volume growth to see whether incremental revenue offsets fee expense. A structured four step process keeps the math clean and auditable:
-
Calculate baseline monthly profit – Multiply monthly visitors by baseline conversion rate, AOV, and gross margin percentage.
-
Model BNPL scenario variables – Apply expected conversion uplift (e.g., +9%), AOV lift (e.g., +20%), and revised return rate (baseline + 15 to 20% relative increase).
-
Compute incremental revenue and gross profit – New orders = visitors × (baseline conversion × uplift factor); new revenue = orders × (baseline AOV × uplift); gross profit = revenue × margin percentage.
-
Subtract BNPL fees and incremental costs – BNPL fees = revenue × percentage fee + (orders × fixed fee); add incremental return handling and chargeback costs; amortize integration expense over expected months; compare net profit to baseline.
Take a baseline of 10,000 monthly visitors, 2.0% conversion (200 orders), $100 AOV, 15% gross margin, and 10% return rate. Baseline gross profit is $3,000 per month. Introducing BNPL at 5.0% + $0.49 with +25% conversion (2.5% = 250 orders) and +30% AOV ($130) yields revenue of $32,500, gross profit of $4,875, and BNPL fees of $1,747.50 (5% of $32,500 = $1,625 plus 250 × $0.49 = $122.50). Returns climb from 10% to 11.5%, so returned orders rise from 20 to around 29. Incremental returned revenue is roughly 9 orders × $130 = $1,170, costing about $175.50 in lost margin. Net profit after fees and extra returns becomes $4,875, $1,747.50, $175.50 = $2,952, slightly below the $3,000 baseline. This scenario shows that low product margins combined with high BNPL fees can destroy profitability even when conversion and AOV rise. It illustrates why merchants with sub 20% margins often restrict or eliminate BNPL.
Break even payback is calculated by dividing one time integration cost by monthly incremental net profit. If integration cost $5,000 and incremental monthly net profit is $750, payback is 6.7 months. Always run three scenarios: conservative (no AOV lift, conversion neutral), base (moderate 15 to 25% AOV lift, +10 to 20% conversion), and aggressive (30 to 40% AOV lift, +25 to 35% conversion). Bracketing uncertainty this way helps you identify the provider with the best downside protection.
Integration, User Experience, and Technical Considerations
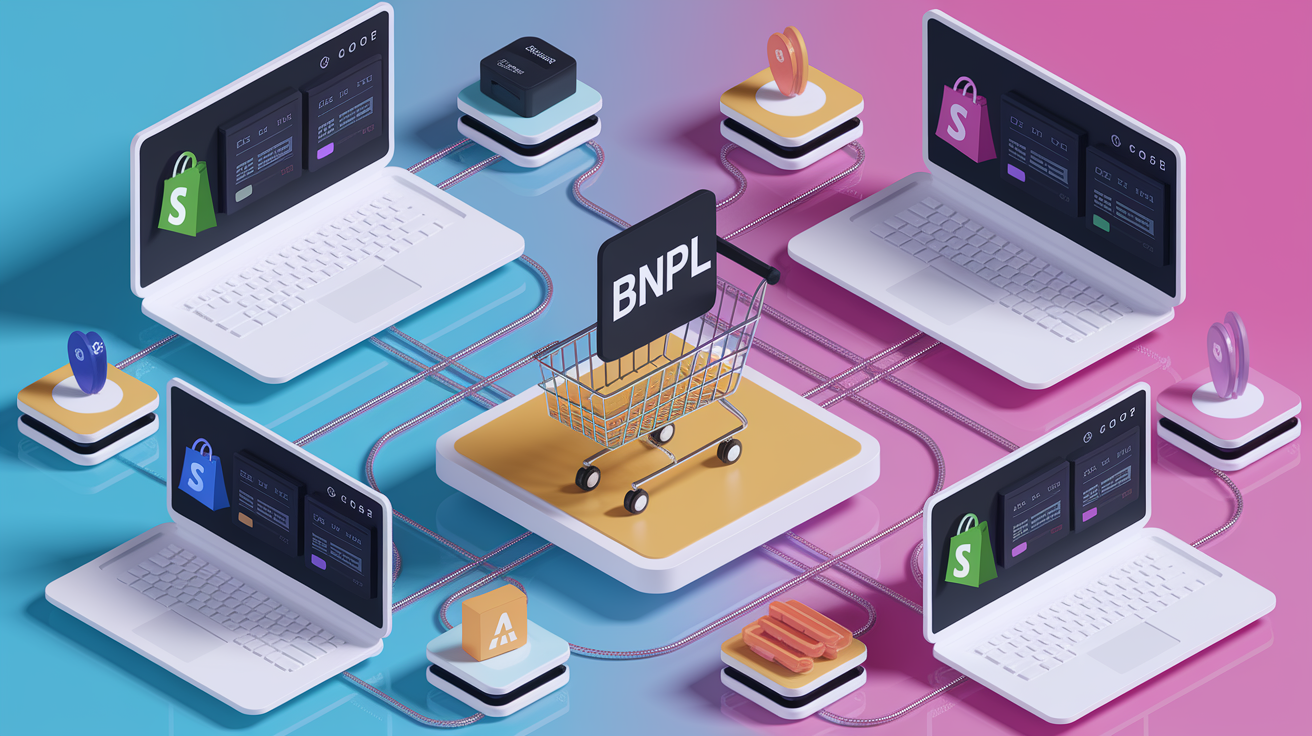
Integration depth determines how smoothly BNPL appears in checkout and how friction free the customer experience remains. Providers offering pre built plugins for Shopify, WooCommerce, Magento, and BigCommerce can go live in hours with minimal developer time. Custom API integrations take longer, typically one to four weeks for a mid market merchant, but unlock lower fees, tighter session control, and better data flow for analytics and reconciliation. Plugin integrations often route transactions through a middleware gateway that clips an additional 0.2 to 0.5% revenue share, raising total effective cost without appearing in the headline fee.
API stability and uptime matter because BNPL authorization happens synchronously at checkout. If a provider’s approval endpoint latency exceeds two seconds or if uptime falls below 99.5%, conversion drops as customers abandon slow or error prone payment steps. Implementation time includes not just code deployment but QA testing across devices, browser types, and edge cases like partial cart changes, promo code stacking, and tax recalculation mid session. Merchants selling internationally must verify that the BNPL widget correctly handles currency, language, and regional compliance (GDPR, PSD2, local consumer finance rules).
Frictionless checkout design has measurable conversion impact. Providers that surface instant approval messaging (“Pay in 4, no interest”) at the product page, cart, and checkout see higher take rates, often 20 to 35% of orders, versus those that only appear at final payment selection. Real time eligibility checks (soft credit pulls or alternative underwriting) reduce customer surprise and failed authorizations at the last step. A smooth UX also reduces support tickets. Clunky integrations generate 2 to 5 tickets per hundred BNPL orders versus under 1 per hundred for polished implementations, adding hidden labor cost that chips away at margin.
Chargeback, Dispute Handling, and Fraud Policies
Chargeback and dispute liability varies sharply across providers and directly affects net merchant cost. Some BNPL platforms assume full fraud and credit risk, meaning you receive guaranteed settlement regardless of consumer default or chargeback. Others pass liability to you, and then you absorb the cost of disputed orders, chargebacks, and any failed collections. When you hold liability, model an annual dispute cost using: dispute rate × average order value × annual order count + (per dispute fee × number of disputes). Typical dispute rates range from 0.1% in low risk categories to 1.5% in higher risk verticals like electronics and fashion.
Dispute resolution processes also differ. Providers with merchant friendly policies offer a single point of contact, handle representment automatically, and resolve cases within 10 to 15 business days. Others require you to upload evidence, manage communication with the end customer, and navigate a 30 to 60 day cycle that ties up refund reserves and creates reconciliation headaches. The quality of fraud screening, whether the provider uses device fingerprinting, velocity checks, and machine learning risk scores, determines how many fraudulent transactions slip through. Weak screening raises chargeback volume and can trigger card network penalties if your overall chargeback rate exceeds 0.9%.
Key risk policy differences to negotiate:
Liability holder – Provider absorbed risk costs more in fees but shields your P&L from volatility.
Chargeback fee amount – $15 to $25 per case. Negotiate caps or waivers at high volume.
Fraud screening depth – Real time decisioning with multi factor signals reduces fraud pass through by 30 to 50% versus basic checks.
Merchants in high return categories (apparel, cosmetics, home goods) should prioritize providers that integrate return data into underwriting and offer partial refund handling without triggering full BNPL fee reversals. Contracts should specify whether fees are refunded pro rata on returns, fully reversed, or retained by the provider, because fee on return policies can swing margin by 0.5 to 1.5% in high return businesses.
Comparing Leading BNPL Providers
Leading providers in 2025 span a range of fee structures, settlement speeds, and demographic strengths, making side by side comparison essential before choosing a partner. PayPal’s Pay in 4 and Pay Monthly options increased merchant fees to 4.99% + $0.49 per transaction in early December 2024, positioning it in the mid tier range with fast settlement (typically 1 to 2 business days) and broad consumer reach across age groups. Klarna charges 5.99% + $0.30, offers strong European and Gen Z penetration, and bundles marketing co promotion tools that can drive repeat purchase but may include revenue share clauses. Afterpay sits at 6.00% + $0.30, targets younger fashion and beauty shoppers, and delivers high conversion lift in those verticals but costs more for merchants outside the sweet spot.
Affirm’s fee range runs 2.0 to 6.0% depending on volume, product category, and contract length, with a focus on longer term installment financing (3, 6, 12 months) rather than pure pay in four. Settlement timing varies by agreement but averages net 7 to net 14 for most merchants. Sezzle and Zip occupy the mid market space with fees around 4.0 to 6.0% and faster approval algorithms that accept a wider credit band, raising approval rates but sometimes increasing default exposure if you absorb risk.
| Provider | Fee Range | Settlement Time | Key Advantage |
|---|---|---|---|
| PayPal (Pay in 4) | 4.99% + $0.49 | 1 to 2 business days | Broad consumer base, fast funding, familiar brand trust |
| Klarna | 5.99% + $0.30 | 2 to 5 business days | Strong European reach, Gen Z appeal, marketing co tools |
| Afterpay | 6.00% + $0.30 | 2 to 3 business days | High conversion lift in fashion/beauty, younger demo skew |
| Affirm | 2.0 to 6.0% | Net 7 to Net 14 | Flexible loan terms (3 to 12 months), credit reporting, enterprise volume discounts |
| Sezzle / Zip | 4.0 to 6.0% | 2 to 7 business days | Higher approval rates, mid market focus, simpler contracts |
PayPal suits merchants who prioritize settlement speed and brand familiarity, especially those already processing card payments through PayPal and seeking bundled pricing. Klarna fits European focused stores and brands targeting Gen Z with co marketing budgets. Afterpay works best for fashion, beauty, and lifestyle verticals where AOVs sit between $75 to $200 and customer demographics skew under 35. Affirm is the go to for higher ticket items ($300+), longer financing terms, and merchants who want credit bureau reporting to reduce default risk. Sezzle and Zip serve mid market merchants who need speed to launch and higher approval rates without enterprise contract complexity.
Final Words
In the action: this post gave a quick decision framework, explained fee types, flagged hidden costs and risk, walked through margin and ROI math, and mapped integration and dispute differences across top providers.
For a fast check, tally AOV, expected fee %, acceptance rate, and likely AOV uplift, then run the simple ROI steps, that quick test shows how to evaluate BNPL providers for merchant fees and margins.
Use this to prioritize pilots, and a small test can protect margin and lift conversion.
FAQ
Q: What are the merchant fees for BNPL and how are they calculated?
A: Merchant fees for BNPL typically run 2–6% per transaction and are calculated as a percentage merchant discount rate plus any fixed per-transaction, tiered, volume-based, or settlement fees.
Q: What is the profit model of BNPL?
A: The profit model of BNPL is merchant fees, consumer interest and late fees, interchange or float income, and revenue from merchant partnerships or data services; how risk is allocated changes net margins.
Q: How much does Klarna charge to merchants?
A: Klarna charges merchants roughly 2%–6% per transaction, varying by country, product mix, volume, and whether Klarna assumes credit risk; exact rates are set in merchant contracts.