

What does a “good” conversion rate even mean anymore?
Most stores land between 2% and 3%, with a 2025 global average of 1.8% (IRP Commerce); on Shopify, 3.2% gets you into the top 20% and 4.7% lands top 10%.
Those benchmarks matter, but they’re only a starting point, and industry, price, device, and traffic source change what’s realistic for your store.
Thesis: use category and channel splits to set a realistic goal — beat your category average or aim for the top 20%.
Do this week: split site rate by device and channel.
Benchmarking a Good Conversion Rate in Ecommerce
Most ecommerce stores convert between 2% and 3% of their visitors. The global average sits at 1.8% based on 2025 IRP Commerce data. If you’re running a Shopify store, breaking 3.2% puts you in the top 20%. Hit 4.7% and you’re in the top 10%. These numbers give you a starting point, but what’s “good” really depends on your industry, what you sell, how much it costs, and where your traffic comes from. Most operators treat 2.5% as the baseline for sustainable growth.
Industry averages vary pretty widely. Food and beverage converts at 2.74%. Health and beauty hits 2.56%, pets 2.46%. Baby products land at 2.27%, health and wellness at 2.02%. Books and music sit at 1.99%, toys and collectibles at 1.91%. Apparel and accessories convert at 1.81%, sports and outdoors at 1.71%. Media and publishing reach 1.69%, consumer electronics 1.68%, home and garden 1.65%. Automotive parts trail at 1.54%. These numbers come from Triple Whale brand data covering September 2024 through August 2025. Beating your category average is a solid definition of “good” for most stores.
Device and traffic source matter as much as your overall number. Mobile conversion rates have climbed over the years, but historically they’ve lagged desktop. More important: not all traffic converts the same. Paid search, direct visits, and email typically convert highest. Cold paid social traffic converts lower because people aren’t actively shopping, they’re scrolling. Organic branded search beats non-branded every time. If you’re only looking at your site-wide rate without splitting by device and channel, you’re missing where the real problems live.
| Industry | Average Conversion Rate |
|---|---|
| Food & Beverage | 2.74% |
| Health & Beauty | 2.56% |
| Pets & Animals | 2.46% |
| Baby | 2.27% |
| Health & Wellness | 2.02% |
| Books & Music | 1.99% |
| Toys, Art & Collectibles | 1.91% |
| Apparel & Accessories | 1.81% |
| Consumer Electronics | 1.68% |
| Automotive | 1.54% |
Understanding Ecommerce Conversion Rates and How They’re Calculated
Conversion rate tells you what percentage of visitors complete a purchase. The math is simple: divide total conversions by total visitors, multiply by 100. This metric connects traffic investment to revenue without needing more ad spend. It also shows whether your site experience, messaging, pricing, or trust signals need work. Track conversion alongside revenue per visitor and average order value to see how efficiently your store turns traffic into cash.
Here’s how it works. You get 50,000 visitors in a month and 1,500 orders. Your conversion rate is (1,500 ÷ 50,000) × 100 = 3%. If those 1,500 orders bring in £105,000, your revenue per visitor is £2.10 and your average order value is £70. When traffic volume is high, small conversion changes create big revenue swings.
Other metrics that add context:
- Revenue per visitor (total revenue ÷ total visitors). Shows commercial efficiency independent of conversion rate.
- Average order value paired with conversion rate. Higher AOV often means lower conversion because people take longer to decide.
- Conversion rate by device. Shows where UX friction concentrates.
- Conversion rate by traffic source. Reveals which channels bring qualified intent.
- Returning customer conversion versus new visitor conversion. Highlights retention efficiency and brand trust.
Industry and Category Differences in Ecommerce Conversion Performance
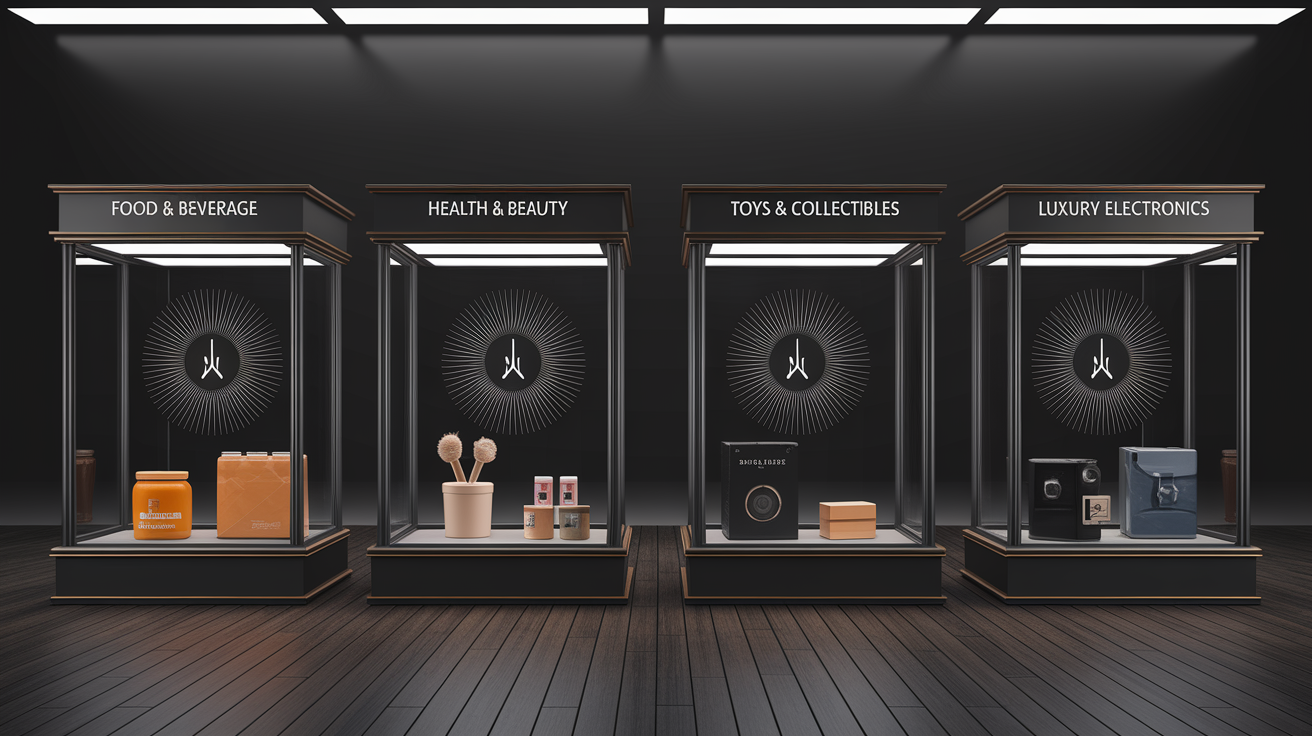
Conversion rates shift by industry because buying behavior isn’t uniform. High-frequency, low-consideration categories like groceries can hit 10% because shoppers already know what they need and aren’t comparing prices much. Categories with longer research cycles, higher prices, or more perceived risk convert lower. Luxury goods, electronics, automotive. Buyers take more time, compare more options, need stronger trust signals. Product type shapes urgency, and urgency drives conversion speed.
Pricing and perceived risk matter. A £15 shirt converts faster than a £1,500 laptop because the cost of getting it wrong scales with price. High-ticket items need more reassurance, detailed specs, return policies, sometimes even human contact. Lower-priced items reduce friction and hesitation. Consideration cycles vary too. Buying running shoes might take two visits over three days. Selecting a mattress can span weeks and multiple competitor tabs. Categories with short consideration windows and repeat buying naturally convert higher.
Demographics and targeting influence performance too. Niche brands serving a specific community or solving a clear problem often convert better than broad-market retailers because intent is pre-qualified. Seasonal swings hit categories differently. Toys spike in Q4, outdoor gear peaks in spring, tax software converts hardest in early April. Competitive density plays a role. Categories with fewer strong alternatives and clearer differentiation convert better than commoditized verticals where shoppers tab between ten near-identical listings.
What drives industry variation:
- Average order value and price sensitivity.
- Urgency and purchase frequency. Daily essentials versus annual purchases.
- Risk perception and product complexity. Technical specs, fit, compatibility.
- Purchase frequency and replenishment cycles. Subscribe-and-save versus one-time.
- Margin structure and how often discounting happens.
- Research and consideration time needed before buying.
- Competitive density and how easy it is to compare across retailers.
Device and Traffic Source Patterns That Influence Ecommerce Conversion Rates

Mobile traffic dominates most stores now, and mobile conversion rates have climbed steadily. Early mobile commerce converted way lower than desktop. Smaller screens, slower load times, clunky navigation, checkout forms built for keyboards. As mobile UX improved and payment methods like Apple Pay and Shop Pay simplified checkout, the gap closed. Mobile still presents friction in categories requiring detailed comparison or complex configuration, but for straightforward purchases mobile can match or beat desktop conversion, especially when the experience is built for thumb navigation and one-handed use.
Traffic source quality determines conversion as much as site design. Email subscribers and direct visitors arrive with high intent and familiarity, so they convert at the top. Paid search captures active purchase intent, strong conversion. Organic search performs well when it’s branded or product-focused. Paid social converts lower because users are scrolling for content, not shopping, and cold traffic needs more nurturing. Referral and affiliate traffic varies depending on audience alignment. Splitting conversion rate by channel helps you allocate budget to highest-return sources and shows where landing page messaging needs to better match arrival intent.
| Traffic Source | Typical Conversion Level |
|---|---|
| High | |
| Direct | High |
| Paid Search | High |
| Organic Search | Medium |
| Paid Social | Low |
Key Factors That Affect a Good Ecommerce Conversion Rate

Site speed and Core Web Vitals directly impact conversion, especially on mobile. Slow-loading stores increase bounce rate and reduce the chance a visitor will wait for product images, reviews, or the add-to-cart button to become interactive. A store that takes four seconds to render on mobile loses conversions before the visitor even sees the product. Performance issues get worse on slower networks and older devices, which still make up a big chunk of traffic in many markets.
Trust signals and social proof cut hesitation. Customer reviews, visible security badges, clear return policies, recognizable payment options all lower perceived risk. Research backs the conversion lift from testimonials and third-party validation. New brands and lesser-known merchants benefit most from trust-building elements because they lack the implicit credibility of established names. Price perception also matters. If your product is priced notably higher or lower than competitors, clear justification helps. Quality, speed, guarantee. Product pages that explain what the item is, why it matters, and what happens after purchase convert better than pages that only list features.
Navigation clarity, mobile rendering quality, image optimization, persuasive copy, form simplicity all influence whether a visitor completes checkout. External factors like campaign timing, site redesigns, and market events can cause temporary swings. A poorly timed redesign that breaks mobile checkout or removes trust elements can tank conversion overnight. Seasonal promotions, shipping cutoffs, inventory scarcity create urgency that lifts conversion temporarily.
Six factors with the biggest impact:
- Site speed and page load performance, especially on mobile.
- Mobile UX quality. Tap target size, navigation simplicity, thumb-friendly layouts.
- Checkout friction. Form length, required account creation, payment method availability.
- Trust signals. Reviews, security badges, return policies, brand credibility markers.
- Product page clarity. Benefit-focused copy, high-quality images, sizing guidance, decision support.
- Traffic quality and intent alignment, determined by channel, targeting, and messaging match.
Practical Strategies to Improve Ecommerce Conversion Rates

The fastest way to lift conversion is reducing friction where most visitors drop off. Start by adding customer reviews and testimonials to product pages. Social proof cuts buyer hesitation and provides reassurance the product delivers. If you don’t have reviews yet, start collecting them through post-purchase emails. Even a handful of verified reviews can improve conversion materially, especially for newer brands.
Next, make sure every product page and landing page has a clear, prominent call to action. The add-to-cart button should be visually distinct, easy to tap on mobile, positioned above the fold. Weak or buried CTAs cost conversions because visitors won’t hunt for the next step. If your CTA isn’t obvious in the first three seconds, it’s not obvious enough.
Run A/B tests to measure what actually works rather than guessing. Split traffic 50/50 between variant A and variant B, then measure which version produces more conversions over a statistically significant sample. Test one variable at a time. Button color, headline, image, checkout flow. So you know what caused the change. Even a 0.5 percentage point increase in conversion rate can add thousands in monthly revenue without increasing ad spend. A store with 50,000 monthly visitors and a 1.4% conversion rate generates 700 orders. Lifting conversion to 1.9% produces 950 orders with the same traffic. That’s 250 additional orders per month.
Streamline your sales funnel by removing unnecessary steps, simplifying forms, offering multiple paths to purchase. Use persuasive landing pages tailored to each traffic source. Offer lead magnets like ebooks or free trials for higher-consideration products to capture emails and nurture intent over time. Discount codes, free shipping thresholds, urgency messaging can convert hesitant shoppers, but use them strategically to avoid conditioning your audience to wait for promotions.
Four high-impact CRO actions to prioritize first:
- Add customer reviews and testimonials to product pages to build trust and reduce hesitation.
- Make calls to action prominent, visually distinct, and mobile-friendly on every product and landing page.
- Run A/B tests on key conversion points. Checkout flow, product page layout, CTA copy. To identify measurable improvements.
- Simplify checkout by offering guest checkout, express payment options like Shop Pay or Apple Pay, and minimal form fields.
Tools and Measurement Methods to Track Ecommerce Conversion Rates
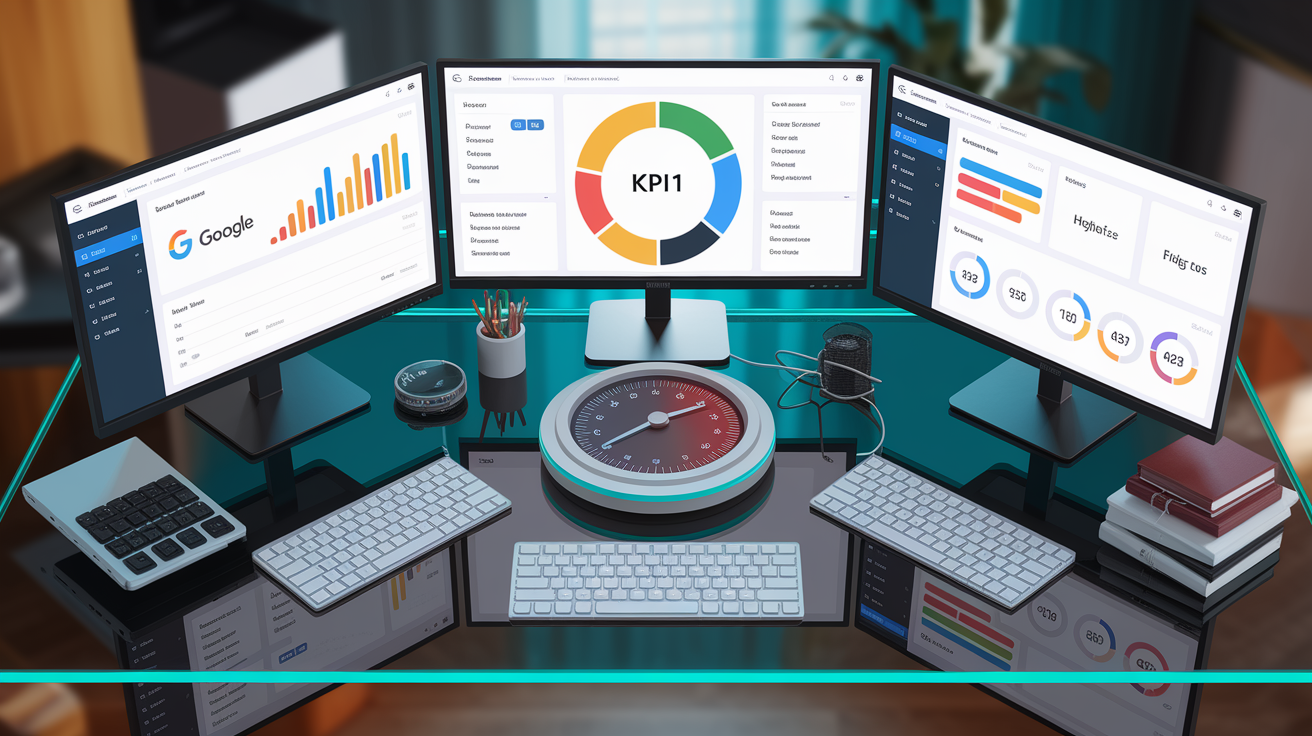
Google Analytics remains the most common tool for tracking ecommerce conversion rates. It segments performance by device, traffic source, landing page, geography, letting you spot where conversion lags. Google Ads and Facebook Ads provide conversion tracking within their platforms, which helps measure return on ad spend and optimize targeting. CRO-specific software like Optimizely, VWO, or Convert adds A/B testing capabilities and experiment tracking. Session recording tools like Hotjar or FullStory show where visitors hesitate, misclick, or abandon checkout, revealing friction that aggregate metrics miss.
Check conversion rate weekly to catch sudden drops caused by technical issues, broken checkout flows, or shipping rate changes. Monitor monthly to assess the impact of optimization work, campaigns, seasonal trends. Review yearly to understand long-term performance, set benchmarks, align conversion goals with business strategy. Use annotations in your analytics tool to mark events like site redesigns, campaign launches, major platform updates. Without context, a conversion spike or drop can be misinterpreted. Trends over time matter more than any single week’s performance.
Six tools and methods for tracking and improving conversion:
- Google Analytics for overall conversion tracking, segmentation by device, source, behavior flow analysis.
- Google Ads and Facebook Ads for channel-specific conversion tracking and campaign-level performance measurement.
- A/B testing platforms like Optimizely, VWO, Convert for running controlled experiments and measuring lift.
- Session recording tools like Hotjar or FullStory for behavioral analysis and identifying friction points.
- Heatmaps and click tracking to see where visitors engage, scroll, drop off on product and checkout pages.
- Customer feedback surveys and exit-intent pop-ups to capture qualitative data on why visitors don’t convert.
Setting Realistic Ecommerce Conversion Targets for Your Store

Realistic conversion targets depend on your industry, traffic mix, average order value, product complexity. A baby products store should aim to beat 2.27%, while an automotive parts retailer would celebrate hitting 1.6%. Compare your performance to your category average first, then layer in device and traffic source benchmarks. If your mobile conversion rate is 1.2% and desktop is 3.8%, the priority is clear. Fix mobile UX rather than chase an arbitrary site-wide goal. Even a 0.5 percentage point improvement can produce material revenue gains without raising acquisition costs. For a store with 50,000 monthly visitors and a £70 AOV, moving from 1.4% to 1.9% adds £17,500 in monthly revenue.
Focus on trends rather than short-term swings. Conversion rate moves week to week due to traffic quality changes, promotions, inventory availability, external factors. A single bad week doesn’t indicate a problem. Three consecutive months of decline does. Set quarterly improvement targets that account for seasonality and realistic testing velocity. If you’re starting at 1.5%, aiming for 3.2% in 90 days isn’t feasible. Targeting 1.8% to 2.0% through focused CRO work is.
Five factors to consider when setting targets:
- Your industry’s average conversion rate and where you currently sit relative to it.
- Traffic source mix and intent quality. High email and direct traffic lifts site-wide averages, heavy paid social traffic suppresses them.
- Average order value and product price point. Higher AOV typically correlates with lower conversion due to consideration time.
- Device mix and mobile optimization level. If 70% of traffic is mobile and mobile UX is weak, expect site-wide conversion to lag.
- Current conversion rate and testing capacity. Incremental improvement is more realistic than doubling performance in one quarter.
Final Words
We opened with the numbers: 2–3% is the common range, 1.8% global average, and Shopify’s >3.2% and >4.7% cutoffs for top stores. The post then lays out industry splits, device and channel patterns, and the conversion formula.
Next, we explained why rates differ and gave practical fixes: reviews, faster pages, simpler checkout, and A/B tests. Prioritize high‑intent channels like email and paid search for quick wins.
Small lifts add up. A half-point gain matters. A good conversion rate for ecommerce is achievable with steady testing and focused fixes.
FAQ
Q: What is a normal ecommerce conversion rate and what is the conversion rate for an e-commerce company?
A: A normal ecommerce conversion rate typically runs around 2–3 percent, with a 2025 global average near 1.8 percent; stores above 3.2% sit in Shopify’s top 20%.
Q: Is a 3.5% or 38% conversion rate good?
A: A 3.5% conversion rate is generally good—above average and often top-quartile; a 38% rate is extremely unusual and likely reflects a narrow funnel, internal metric, or tracking error.