
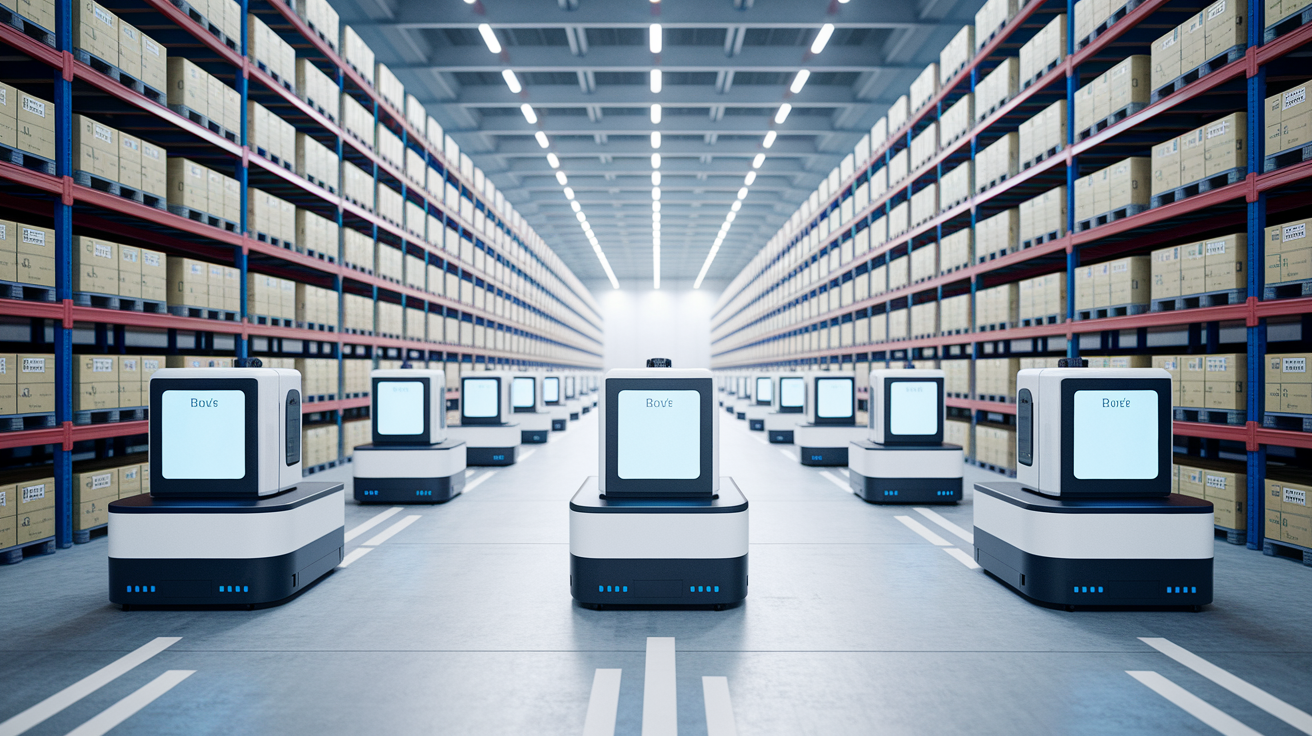

Think micro‑fulfillment centers are a shiny gadget for big brands?
Here’s the practical truth: properly set up micro‑fulfillment can cut cost‑per‑order 40–60% and usually pays back in 24–36 months, with CapEx of about $1M–$3.5M.
This post lays out real cost figures, step‑by‑step ROI math, and the customer patterns that make MFCs work for DTC brands.
If you ship 10,000+ orders per month, it’s worth modeling now.
Smaller volumes should still run a simple payback test: monthly orders × savings per order ÷ total investment.
ROI Metrics and Financial Outcomes of Micro‑Fulfillment Centers

Most DTC brands evaluating micro‑fulfillment centers want a straight answer on payback. You’re looking at 24 to 36 months, depending on how many orders you ship, how complex your automation gets, and what you’re spending now. Capital investment for a single micro‑fulfillment center runs between $1 million and $3.5 million USD. That covers automation equipment, racking, robotics, installation labor, and whatever your facility needs to make it work. Brands pushing 10,000+ orders per month usually hit the lower end of that payback range. Lower volume? You’re stretching toward 36 months or longer.
Operational improvements are what actually pay you back. Automation typically cuts cost‑per‑order by 40 to 60 percent compared to manual picking in traditional warehouses or relying on external 3PLs. Order‑processing speed often jumps over 200 percent. You go from roughly 50 units per hour in manual operations to 300–600 UPH with goods‑to‑person systems or autonomous mobile robots. Inventory accuracy in automated micro‑fulfillment environments frequently hits 99 percent or higher, which eliminates costly mispicks, chargebacks, and all the customer‑service overhead tied to sending the wrong item.
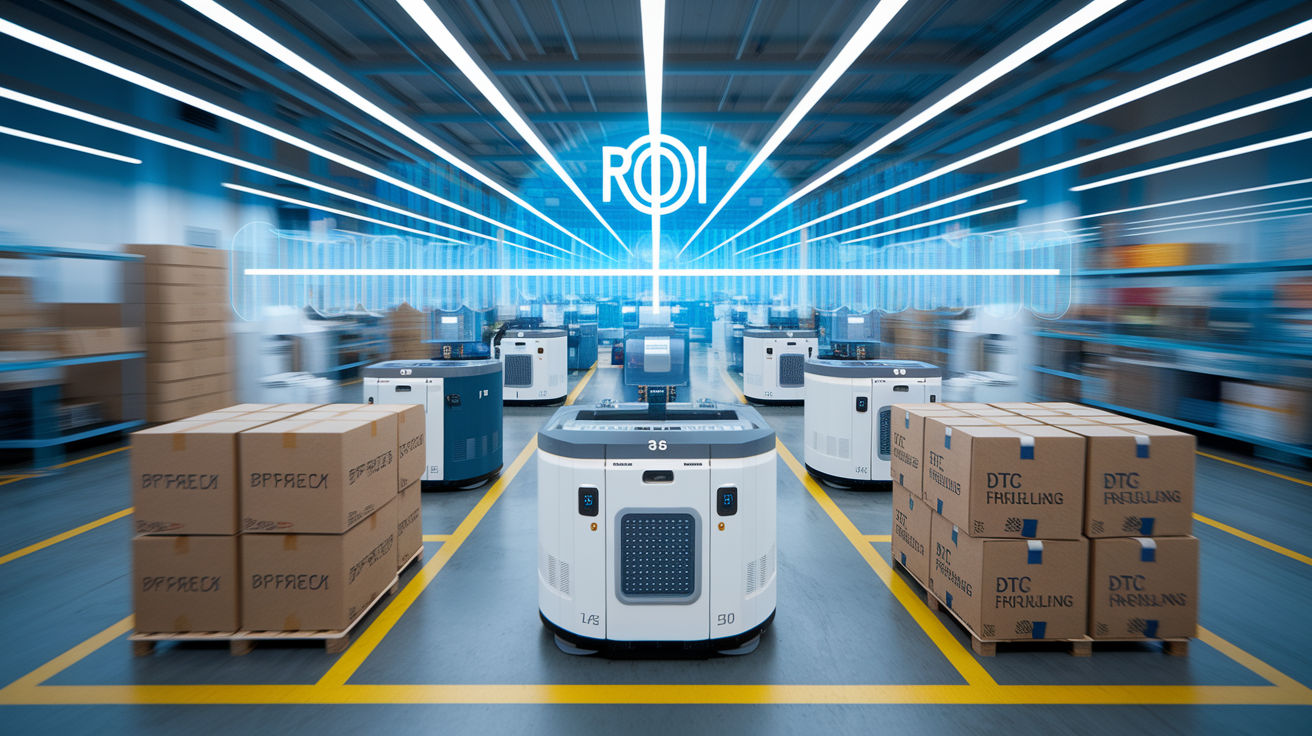
ROI calculations for micro‑fulfillment centers start with three inputs: average monthly order volume, baseline cost per order (labor plus pick‑pack‑ship), and expected percentage reduction in that cost. Multiply annual order volume by the per‑order savings to estimate annual dollar savings. Divide total capital and first‑year implementation costs by annual savings to get your payback years. For example, a brand shipping 15,000 orders per month at $8 per order baseline cost, achieving a 50 percent reduction, saves $6 per order times 180,000 orders, which equals $720,000 annually. If total investment is $2 million, payback is 2.8 years. Add incremental margin gains from faster delivery (often 15 to 30 percent higher per order) and payback shortens.
| Metric | Typical Value |
|---|---|
| ROI / Payback Period | 24–36 months |
| Cost‑per‑Order Reduction | 40–60% |
| Order Throughput Increase | 200%+ (50 UPH → 300–600 UPH) |
| Inventory Accuracy | 99%+ |
Cost Structure: CapEx vs OpEx Breakdown for Micro‑Fulfillment
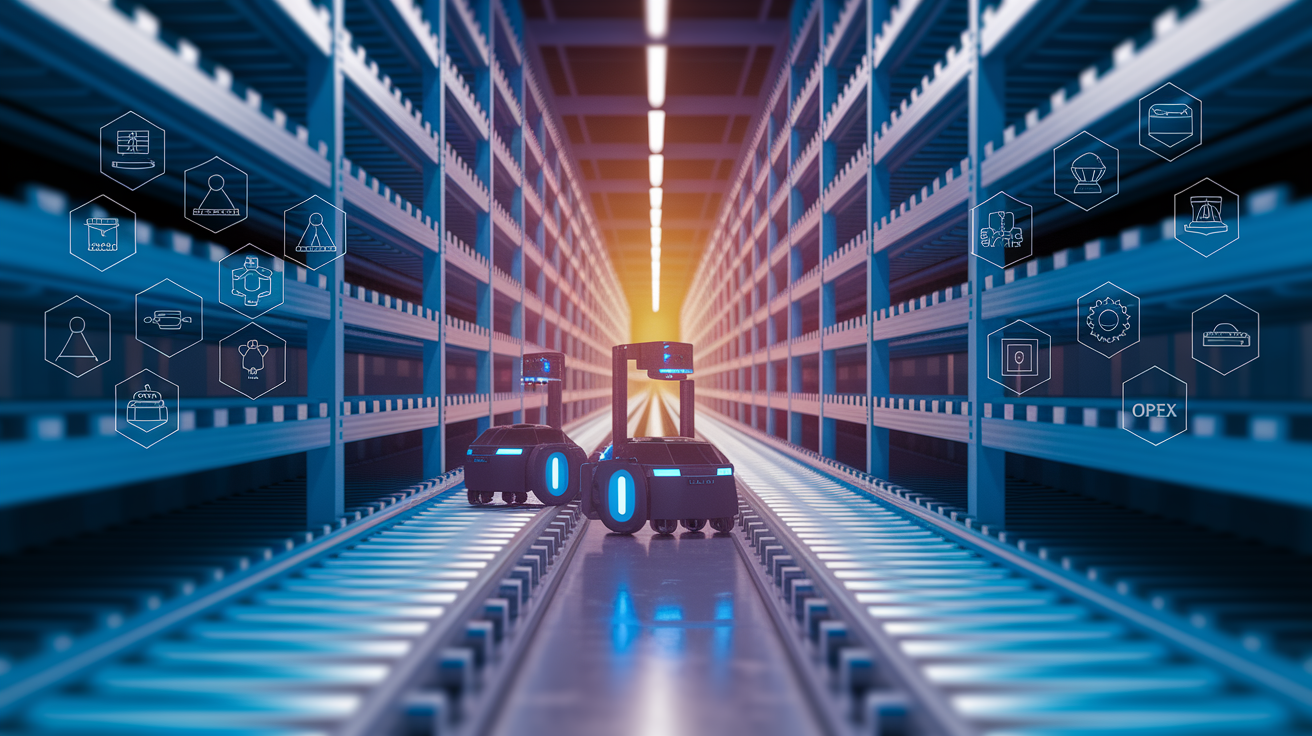
Capital expenditure for a micro‑fulfillment center includes automation hardware like autonomous mobile robots, conveyor systems, goods‑to‑person shuttle systems, vertical lift modules, plus steel racking, barcode scanners, label printers, and RFID readers. Facility modifications such as electrical upgrades, HVAC adjustments for equipment cooling, floor reinforcement for heavier robotics, and fire‑suppression system upgrades add to upfront costs. Installation labor, system commissioning, initial software licensing (perpetual or first‑year subscription), and employee training round out CapEx. Small‑format micro‑fulfillment centers (under 10,000 square feet) skew toward the $1 to 1.5 million range. Mid‑size deployments (10,000 to 25,000 square feet) with higher‑density automation push $2 to 3.5 million.
Operating expenses recur monthly and include ongoing labor (reduced headcount but still required for exception handling, packing stations, returns processing, and system oversight), preventive maintenance contracts for robotics and conveyors, utilities (electricity for motors and HVAC), software‑as‑a‑service fees for warehouse management systems and order management platforms, insurance for high‑value automation equipment, and replenishment transportation costs to restock the micro‑fulfillment center from upstream distribution centers. Annual OpEx typically runs 15 to 25 percent of CapEx for small‑format centers and 20 to 30 percent for higher‑throughput sites with more complex robotics.
CapEx Components:
Automation equipment (robots, conveyors, shuttle systems, vertical lift modules), racking, material handling infrastructure, barcode/RFID hardware, facility modifications (electrical, HVAC, structural reinforcement, fire suppression).
OpEx Components:
Labor (reduced headcount for pick/pack/exception handling/oversight), maintenance contracts, spare parts, preventive service for robotics, software subscriptions (WMS, OMS, integration middleware), utilities, insurance, inbound replenishment transport.
Savings Levers that Drive Positive ROI
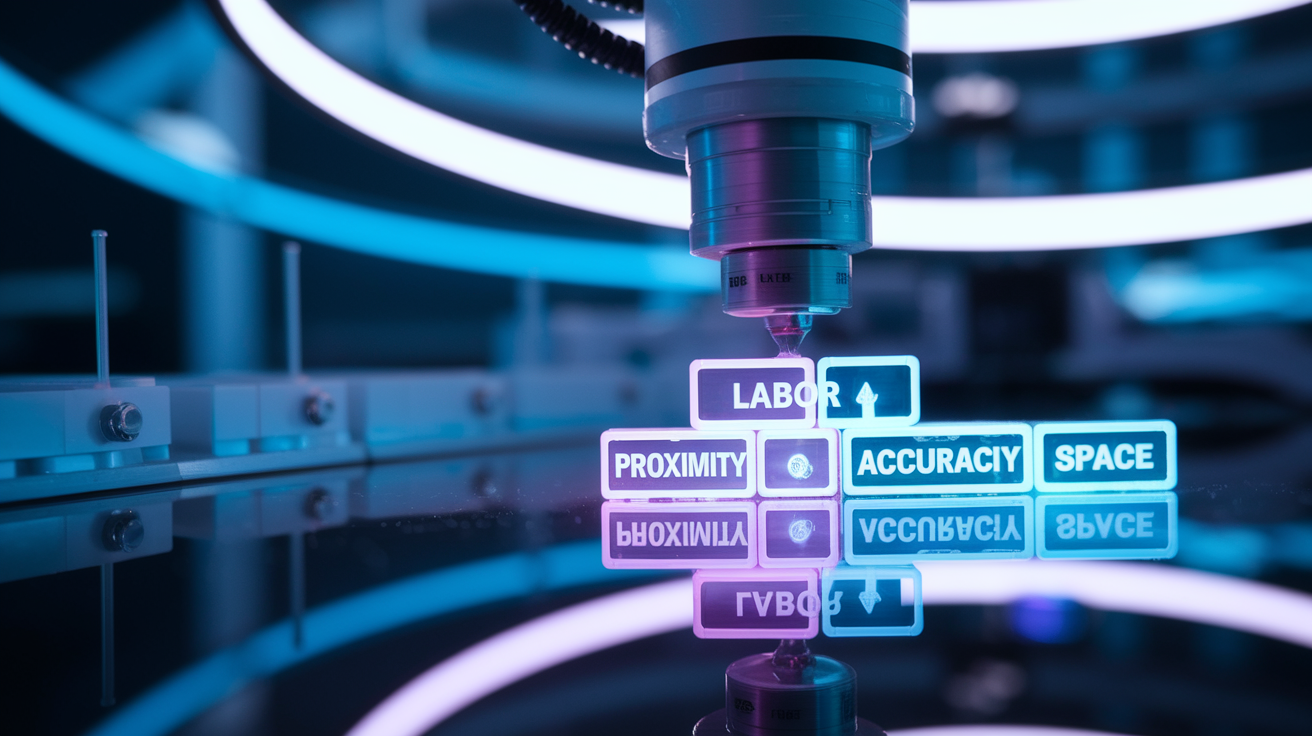
Labor represents the largest controllable expense in fulfillment. Manual picking averages roughly 50 units per hour. Goods‑to‑person and AMR systems push that rate to 300–600 UPH. A single automation‑assisted picker replaces the output of six to twelve manual pickers, cutting labor costs by 40 to 70 percent. Reduced headcount also lowers payroll taxes, benefits, workers’ compensation premiums, and hiring/training overhead. Brands operating in high‑wage markets (urban centers, West Coast) see the steepest labor savings.
Proximity to customers compresses shipping zones and reduces last‑mile carrier costs. A traditional centralized warehouse in the Midwest ships many coastal orders at Zone 6 to 8 rates. A micro‑fulfillment center in metro New York, Los Angeles, or Chicago delivers the same order at Zone 2 to 3 rates, cutting per‑package shipping costs by $2 to 4. Over 180,000 annual orders, that reduction alone saves $360,000 to $720,000 per year. Faster transit times also reduce the need for expedited service upgrades, letting brands hit 2‑day delivery promises with ground rates instead of 2‑day air.
Automation‑driven accuracy eliminates costly downstream problems. Manual picking error rates run 1 to 3 percent. Automated systems with barcode verification and weight checks drop errors below 0.5 percent. Each mispick costs $15 to 30 in customer service time, reshipping, return postage, and potential refunds or discounts. At 1 percent error rate and 180,000 orders, a brand incurs 1,800 errors per year times $20 average, which equals $36,000 in avoidable costs. Higher accuracy also reduces returns driven by “wrong item received,” improving net margin and customer lifetime value.
Primary Savings Levers:
Labor cost reduction (40 to 70% fewer hours per order via automation throughput), transportation zone compression (proximity cuts per‑package shipping $2 to 4), accuracy improvement (sub‑0.5% error rate eliminates mispick costs), space optimization (vertical storage and dense automation reduce rent per order), pick‑speed increase (300 to 600 UPH versus 50 UPH shortens cycle time and expands daily capacity without adding shifts).
Real‑World DTC Case Studies Demonstrating ROI
A direct‑to‑consumer apparel brand shipping 12,000 orders per month from a manual 3PL transitioned to a 15,000‑square‑foot micro‑fulfillment center equipped with autonomous mobile robots and goods‑to‑person workstations. Baseline cost per order was $9.20 (labor, pick‑pack materials, and allocated rent). Post‑implementation, cost per order dropped to $5.50, a 40 percent reduction driven almost entirely by labor savings. The brand cut staffing from 18 full‑time pickers to 7, redeploying savings into customer acquisition. Annual order volume of 144,000 orders times $3.70 savings per order equals $532,800 in annual savings. Total investment of $1.4 million yielded payback in 31 months.
A beauty and skincare DTC brand operating in the subscription and one‑time‑purchase model faced growing cart‑abandonment tied to long delivery windows. Fulfillment from a single East Coast warehouse meant 4 to 5 day delivery to West Coast customers. The brand opened two micro‑fulfillment centers, one in metro Los Angeles, one in metro Dallas, enabling 1 to 2 day ground delivery to 70 percent of the customer base. Order volume increased 18 percent within six months as delivery‑speed messaging improved conversion rates. Shipping cost per order dropped $2.10 due to zone compression, and the brand eliminated $40,000 per year in 2‑day air upgrades previously used to meet promotional promises.
A direct‑to‑consumer nutrition and supplement brand processing 8,000 orders per month implemented a compact micro‑fulfillment center with vertical lift modules and automated pack stations. Manual throughput had been 55 units per hour per picker. Automation pushed throughput to 320 UPH, a 150 percent increase. The brand maintained the same labor headcount but tripled daily order capacity, supporting aggressive growth without a second facility lease. Cost per order fell from $7.80 to $4.60, saving $3.20 per order. At 96,000 annual orders, that delivered $307,200 in annual savings against a $1.1 million investment, yielding payback in 43 months. The brand credited the investment with enabling same‑day delivery pilots in two metro markets, driving repeat purchase rates up 12 percent.
A pet‑supply DTC brand shipping heavy products (food, litter) faced high shipping costs and slow manual pick rates due to bulky SKUs. The brand deployed a micro‑fulfillment center with conveyor‑assisted pick‑and‑pack lines and pallet‑flow racking optimized for case picking. Throughput increased from 40 orders per hour to 110 orders per hour per line. Labor cost per order dropped 35 percent, and proximity to a major metro area reduced average shipping cost by $3.50 per order due to shorter zones and the ability to use regional carriers for final‑mile delivery. Total investment was $1.8 million. Annual savings reached $640,000 (labor plus shipping). Payback landed at 28 months, and the brand opened a second center 14 months later to replicate results in another region.
Micro‑Fulfillment vs Traditional 3PL and Warehouse Fulfillment
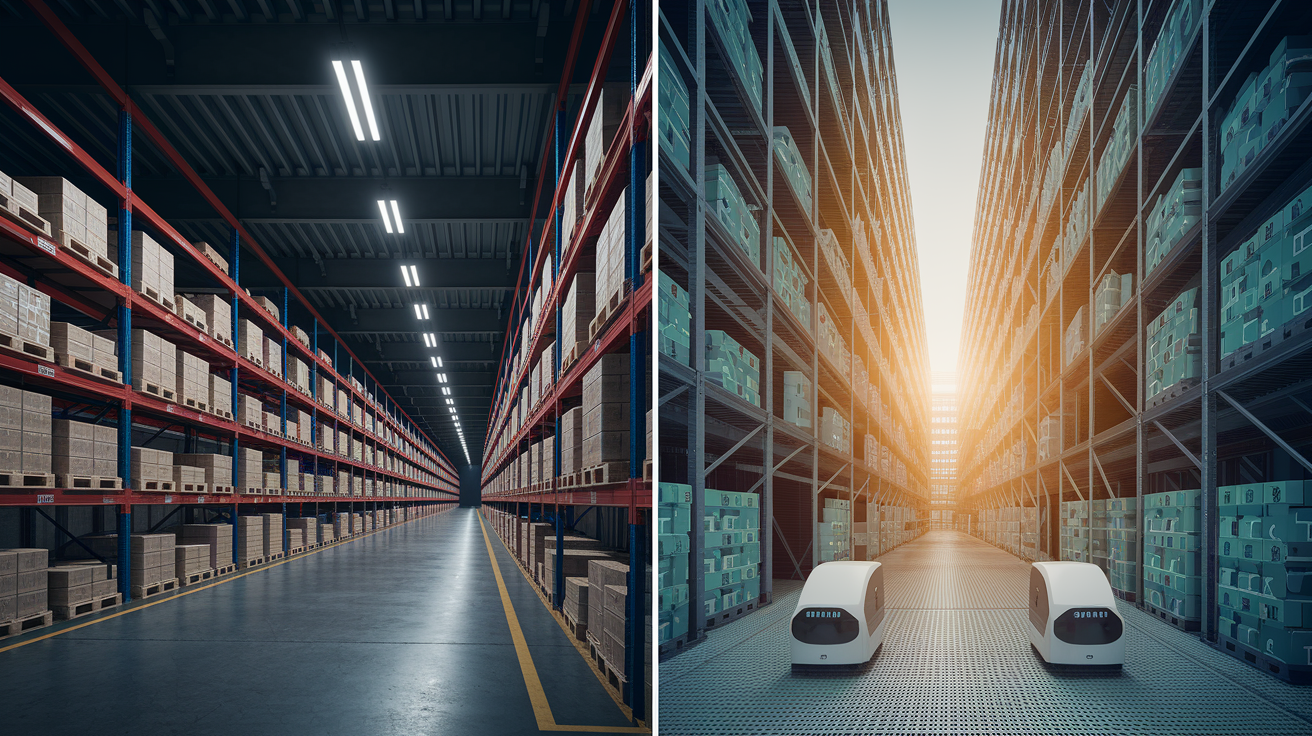
Traditional fulfillment relies on manual batch‑or‑wave picking, where pickers walk aisles with carts or push totes on conveyor takeaway lines. Pick rates average 50 to 80 units per hour, and accuracy depends on picker training, fatigue, and SKU similarity. Large distribution centers optimize for pallet‑in/pallet‑out flows and case picking for wholesale or retail replenishment. Ecommerce each‑pick represents a secondary, often less‑efficient workflow. Labor is the dominant cost, and scaling requires proportional headcount increases. Footprint requirements are large (100,000+ square feet is common), and facilities are typically located in lower‑cost secondary markets far from urban customer clusters, pushing orders into Zone 5 to 8 shipping.
Micro‑fulfillment centers use goods‑to‑person automation, autonomous mobile robots, or vertical lift modules to bring inventory to stationary pickers. Walk time per pick drops by up to 90 percent, pushing throughput to 300 to 600 UPH. Facilities are small (5,000 to 25,000 square feet), urban or suburban, and located close to customer density, enabling Zone 2 to 3 ground delivery. Automation handles the majority of item retrieval and sortation. Human labor focuses on exception handling, packing, and quality checks. Scaling throughput is achieved by adding robots or modules rather than hiring proportionally more pickers. Accuracy improves through barcode verification at every handoff, weight checks at pack stations, and automated imaging.
| Category | Traditional Fulfillment | Micro‑Fulfillment |
|---|---|---|
| Pick Rate (UPH) | 50–80 | 300–600 |
| Cost per Order | $7–12 | $4–6 |
| Accuracy | 97–99% | 99%+ |
| Footprint Size | 100,000+ sq ft | 5,000–25,000 sq ft |
| Shipping Zones (Typical) | Zone 5–8 (distant fulfillment) | Zone 2–3 (local/regional) |
Implementation Requirements and Risk Factors Affecting ROI

Micro‑fulfillment economics work best when order volume exceeds 5,000 to 8,000 orders per month and SKU velocity is concentrated, typically 80 percent of orders fulfilled from 20 to 30 percent of SKU catalog. Brands with highly fragmented, slow‑moving long‑tail assortments struggle to achieve density and throughput targets, leaving automation underutilized and ROI stretched. Peak‑to‑trough order volatility also matters. Facilities designed for peak‑season volume sit idle during off‑peak months, increasing per‑order fixed costs. Successful implementations start with SKU rationalization: high‑velocity SKUs stock the micro‑fulfillment center, while slow movers fulfill from a central warehouse or drop‑ship.
Implementation timelines range from 4 to 12 months, depending on facility readiness, automation complexity, and integration scope. Greenfield builds or extensive retrofits (structural, electrical, HVAC) push toward 10 to 12 months. Deploying automation into an existing leased space with minimal modifications can complete in 4 to 6 months. Integration with warehouse management systems, order management platforms, and carrier APIs represents the most common schedule risk. Poor API documentation, legacy system constraints, or lack of middleware expertise delay go‑live and extend the period before ROI starts accruing. Brands should budget 8 to 12 weeks for software integration, testing, and parallel‑run validation before flipping traffic to the new center.
The largest ROI‑threatening risk is underutilization. A micro‑fulfillment center designed for 20,000 orders per month but processing only 8,000 incurs full fixed costs (lease, utilities, maintenance contracts, minimum labor) with half the expected throughput, doubling effective cost per order. Demand volatility (seasonal peaks, promotional spikes, new‑product launches) requires accurate forecasting and flexible labor models (temporary staff, variable shifts). System complexity and change‑management failures also erode ROI: if pickers resist new workflows, bypass barcode scans, or mistrust automation, accuracy and speed gains disappear. Robust training, clear standard operating procedures, and performance dashboards visible to frontline staff mitigate this risk.
Six Implementation Considerations:
Space needs: 5,000 to 25,000 sq ft depending on throughput, ceiling height 16+ feet for vertical storage. Software requirements: WMS with automation API support, OMS integration, real‑time inventory sync, carrier integration for multi‑carrier rate shopping. Labor training: 2 to 4 weeks for picker onboarding, exception‑handling protocols, system‑override procedures. SKU suitability: high‑velocity concentration (top 20 to 30% of SKUs drive 80% of volume), low‑value, slow movers excluded. Demand thresholds: minimum 5,000 to 8,000 orders/month to justify automation investment and achieve target cost‑per‑order. Data integration: bidirectional sync between OMS, WMS, ERP, and carrier systems, API uptime SLAs and failover plans mandatory for live operations.
Final Words
We showed typical payback of 24–36 months, CapEx around $1M–$3.5M, and automation that cuts cost‑per‑order substantially.
You got concrete outcomes: 40–60% lower cost‑per‑order, order‑processing speeds often 200%+, and inventory accuracy near 99%. Those move the needle on margin and delivery.
Run a simple payback model on your top SKUs, check order volume thresholds, and pilot proximity-based fulfillment. Early signals suggest micro-fulfillment centers ROI for DTC brands is reachable and worth testing.
FAQ
Q: How much does a micro fulfillment center cost?
A: A micro-fulfillment center costs about $1M–$3.5M in upfront CapEx, with typical payback of 24–36 months; automation usually cuts cost-per-order and boosts order-processing speed significantly.
Q: What is the difference between a dark store and a micro fulfillment center?
A: The difference between a dark store and a micro-fulfillment center is that a dark store is a repurposed retail outlet for manual online picking, while a micro-fulfillment center is compact, automated, and optimized for rapid high-throughput fulfillment near customers.
Q: What is a micro fulfillment center?
A: A micro-fulfillment center is a small, automated warehouse near customers that uses dense storage, robotics, and software to speed picking, reduce last-mile shipping costs, and improve inventory accuracy.
Q: What are two characteristics of fulfillment centers?
A: Two characteristics of fulfillment centers are high order-processing throughput and organized storage with pick zones that drive accuracy and fast shipping.