


If your personalization is mostly decorative, it’s costing you real revenue. In 2026 ecommerce personalization benchmarks for DTC brands, product recommendations lift conversions +12–30%, AI-assisted visitors convert 12.3% versus 3.1% unassisted, and automated email flows earn $2.87 per recipient versus $0.18 for broadcasts. Adoption has hit critical mass, but top performers capture preference signals from 60%–80% of visitors early. Read on for the benchmarks that matter, who wins, and three small audits you can run this week.
Key 2026 Personalization Benchmarks DTC Brands Must Compare Against

Personalization in 2026 isn’t measured by whether you have it. It’s measured by what it actually does for revenue. DTC brands see conversion lifts between 12% and 30% from product recommendations alone. Email personalization pushes click-through rates up 20% to 45%, with conversions jumping 10% to 30%. Automated flows now pull in 41% of total email revenue despite making up just 5.3% of sends. Per-recipient revenue from these flows averages $2.87 versus $0.18 for broadcast campaigns. That’s an 18x gap. Brands using AI-assisted engagement convert visitors at 12.3%, compared to 3.1% for self-serve shoppers. A 4x performance divide that separates who’s winning from who’s falling behind.
Adoption’s hit critical mass. Around 85% of DTC brands run at least one personalization tactic, and 55% to 65% use AI-driven or predictive personalization across recommendations, dynamic content, or search. The typical DTC site exposes 40% to 70% of traffic to personalized experiences. Homepage modules, email-synced promos, behavioral carousels. First-party data underpins all of it. Top performers capture usable preference or behavior signals from 60% to 80% of visitors within the first session or two.
Brands track conversion lift, AOV uplift, repeat purchase rate improvement, CLTV gains, and incremental revenue per visitor. They compare against category norms and their own pre-personalization baselines, isolating impact through holdout groups and controlled experiments. The gap between median and top-quartile performance is wide enough that fixing one or two high-leverage personalization gaps can move a brand from middle of the pack into the top 25%.
Essential 2026 DTC Personalization KPI Benchmarks:
- Conversion Rate Lift: Onsite recommendations +12% to +30%. Email personalization +10% to +30%. Dynamic homepage/category content +8% to +20%. AI-engaged visitors convert at 12.3% vs 3.1% baseline.
- AOV Uplift: Personalization-driven AOV increases typically +10% to +30%. Checkout cross-sell and upsell +8% to +20%. Recommendation-engaged sessions show AOV improvements up to +369%.
- Traffic Personalization Exposure: 40% to 70% of site sessions interact with personalized elements. Top performers exceed 70%.
- Email Revenue Per Recipient: Automated personalized flows $2.87. Broadcast campaigns $0.18 (18x difference).
- AI Engagement Conversion Rate: 12.3% for AI-assisted interactions vs 3.1% for unassisted self-serve browsing.
- Customer Lifetime Value (CLTV) Uplift: +15% to +40% for brands with mature lifecycle personalization and orchestration.
Conversion Performance Benchmarks From Personalization in 2026
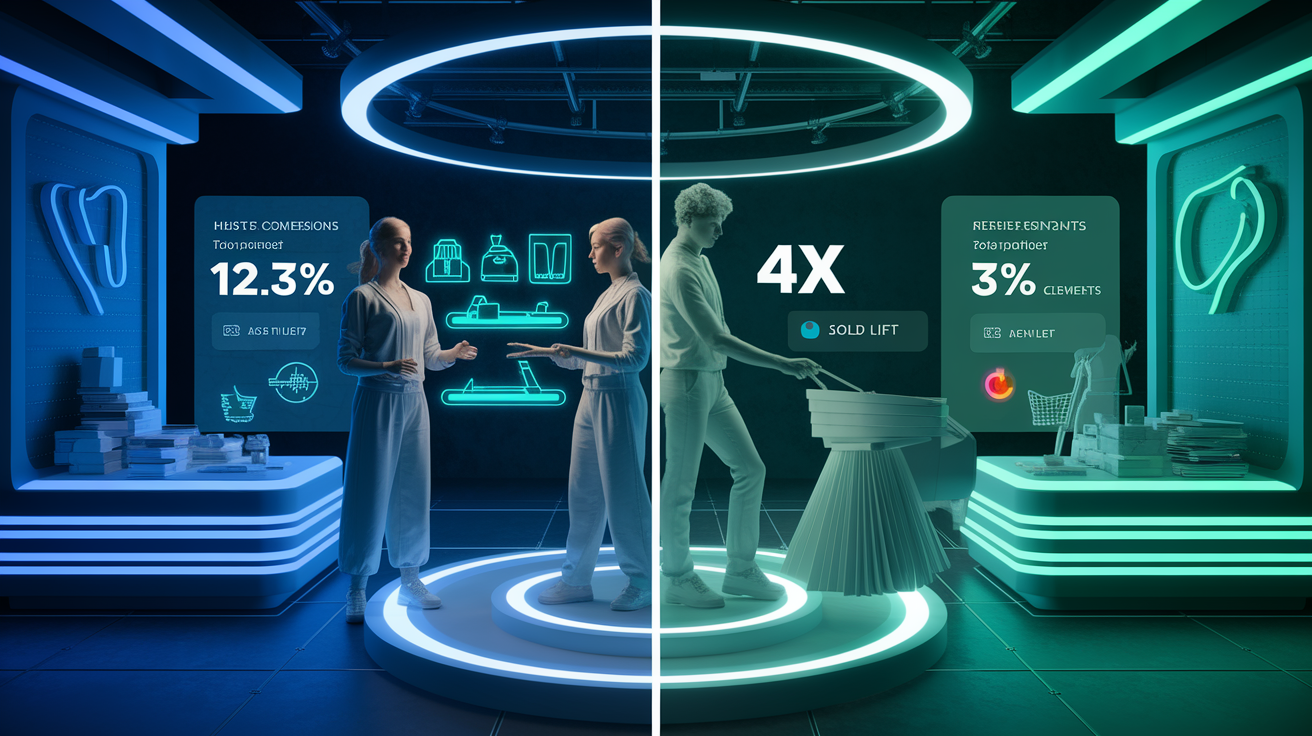
Behavioral personalization lifts conversion by surfacing the right product, offer, or content at the moment a shopper signals intent. Onsite product recommendations generate conversion lifts between 12% and 30%, with click-through rates on recommendation modules ranging from 5% to 12%. AI-powered personalized search delivers conversion improvements of 10% to 35% by interpreting query intent and surfacing contextually relevant results. Dynamic homepage and category personalization adds 8% to 20% conversion lift. Adjusting hero images, featured collections, or messaging based on visitor segment.
The largest single gap in 2026 is between AI-engaged and self-serve visitors. Shoppers who interact with conversational AI, guided product finders, or intelligent chatbots convert at 12.3%, compared to 3.1% for those navigating unassisted.
Offsite personalization drives measurable conversion improvements too, though the mechanics differ. Personalized email campaigns lift click-to-purchase conversion by 10% to 30%, while retargeted dynamic ads improve conversion by 15% to 25% versus generic creative. The key differentiator is contextual continuity. Personalization that reflects what the visitor previously viewed, added to cart, or expressed preference for significantly outperforms broad segmentation or one-size-fits-all messaging.
| Tactic | Typical Conversion Lift |
|---|---|
| Onsite Product Recommendations | +12% to +30% |
| AI-Assisted Engagement (Chat/Finder) | +4× baseline (12.3% vs 3.1%) |
| Personalized Search & Discovery | +10% to +35% |
| Dynamic Homepage/Category Content | +8% to +20% |
| Email Personalization (Flows) | +10% to +30% |
AOV & Cross‑Sell Benchmarks Shaped by 2026 Personalization
Personalization increases average order value by presenting complementary products, bundles, or higher-margin alternatives that align with the shopper’s demonstrated preferences. Across all tactics, personalization-driven AOV improvements typically range from 10% to 30%. Checkout cross-sell and upsell modules deliver 8% to 20% AOV gains. Recommending accessories, warranties, or volume discounts at the point of purchase. Sessions in which a visitor engages with product recommendations show AOV uplifts as high as 369%, reflecting both larger basket sizes and higher-value item selection.
The compounding effect is clear. Personalization not only converts more visitors but converts them at higher transaction values.
Customer lifetime value improvements from personalization range from 15% to 40%, driven by higher first-purchase AOV, increased repeat purchase rates, and more effective cross-category expansion over time. Brands that personalize onboarding, replenishment reminders, and loyalty rewards see the strongest CLTV gains. These tactics reduce time-to-second-purchase and increase purchase frequency. Personalization isn’t just a top-of-funnel conversion tool anymore. It’s a retention and value-expansion lever.
Key Financial Lift Benchmarks from Personalization:
- Overall AOV Uplift: +10% to +30% across personalized tactics.
- Checkout Cross-Sell/Upsell AOV Gain: +8% to +20%.
- Recommendation-Engaged Session AOV: Up to +369% versus non-engaged sessions.
- Customer Lifetime Value (CLTV) Improvement: +15% to +40% for brands with lifecycle personalization.
Retention, Repeat Purchase, and Lifecycle Personalization Benchmarks
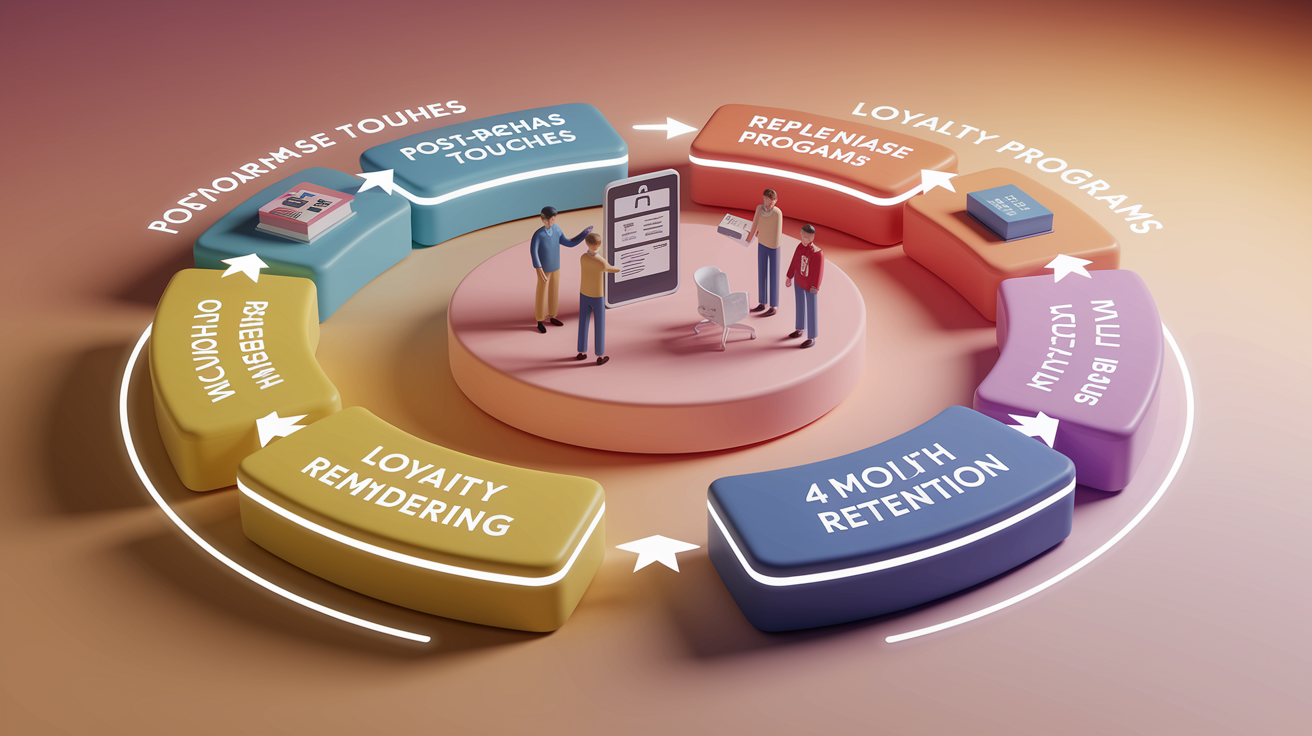
Lifecycle personalization lifts repeat purchase rates by 8% to 20% within six to twelve months. Tailoring messages, offers, and product recommendations based on purchase history, engagement cadence, and predicted next action. Brands that personalize post-purchase flows, replenishment reminders, win-back campaigns, and loyalty program communications see measurably higher second-purchase conversion and shorter time-to-repurchase.
The economic impact is significant. The median DTC brand loses about $29 on the first sale to a new customer but earns $39 profit per repeat transaction. Retention and repeat purchase directly determine profitability.
Subscription models benefit particularly strongly from personalization. Brands that personalize onboarding sequences, subscription management interfaces, and renewal offers report LTV-to-CAC ratios of 4:1 to 7:1, compared to 3:1 for non-personalized programs. Personalized churn-prevention flows can recover 15% to 30% of at-risk subscribers. Triggered by engagement drop-offs, skipped shipments, or subscription pauses. Personalization shifts the retention question from “Did they buy again?” to “How many times, how soon, and at what value?”
Customer lifetime value improvements of 15% to 40% are the norm for brands with mature personalization across onboarding, cross-sell, replenishment, and loyalty. These gains compound over cohorts. A 20% CLTV improvement sustained across twelve months of new customer acquisition can transform unit economics and unlock profitable top-line growth. Retention-focused personalization isn’t optional for DTC brands operating under 2026 acquisition costs.
Email Personalization Benchmarks for 2026 DTC Programs
Email personalization drives measurably higher engagement and revenue per recipient. Baseline open rates for well-maintained DTC email lists average 43% to 45%, but personalized automated flows achieve open rates between 50% and 84%, with welcome emails reaching 83.6%. Click-through rate lifts from personalization range from 20% to 45%, and conversion lifts span 10% to 30%. The revenue difference is stark. Automated personalized flows generate $2.87 revenue per recipient, compared to $0.18 for broadcast campaigns. A factor of 18x.
Flows represent only 5.3% of total email send volume but produce 41% of total email revenue. That’s the efficiency of triggered, contextual messaging over batch-and-blast campaigns. Abandoned-cart emails, when sent within one hour of cart abandonment, convert at 10.7%. The median abandoned-cart flow converts at 3.33%, with top performers reaching 7.69%. Product-matching recommendations embedded in post-purchase and browse-abandonment emails increase click-to-purchase conversion by 15% to 40% versus generic product blocks.
Segmentation further amplifies performance. Emails segmented by behavioral signals outperform static demographic segments by 10% to 25% in conversion. Recent category browsed, price sensitivity, purchase frequency. Personalized subject lines and preview text lift open rates by 5% to 15%. The 2026 benchmark is clear. Email revenue is increasingly concentrated in automated, personalized flows, and brands still relying primarily on broadcast campaigns are leaving measurable revenue on the table.
| Email Tactic | Benchmark Metric | 2026 Typical Range |
|---|---|---|
| Automated Flows (Welcome, Cart, Browse) | Revenue per Recipient | $2.87 |
| Broadcast Campaigns | Revenue per Recipient | $0.18 |
| Abandoned Cart Flow | Conversion Rate | 3.33% median; 7.69% top quartile; 10.7% if sent within 1 hour |
| Personalized Email (CTR Lift) | Click-Through Rate Improvement | +20% to +45% |
Personalization Benchmarks by DTC Category and Customer Type
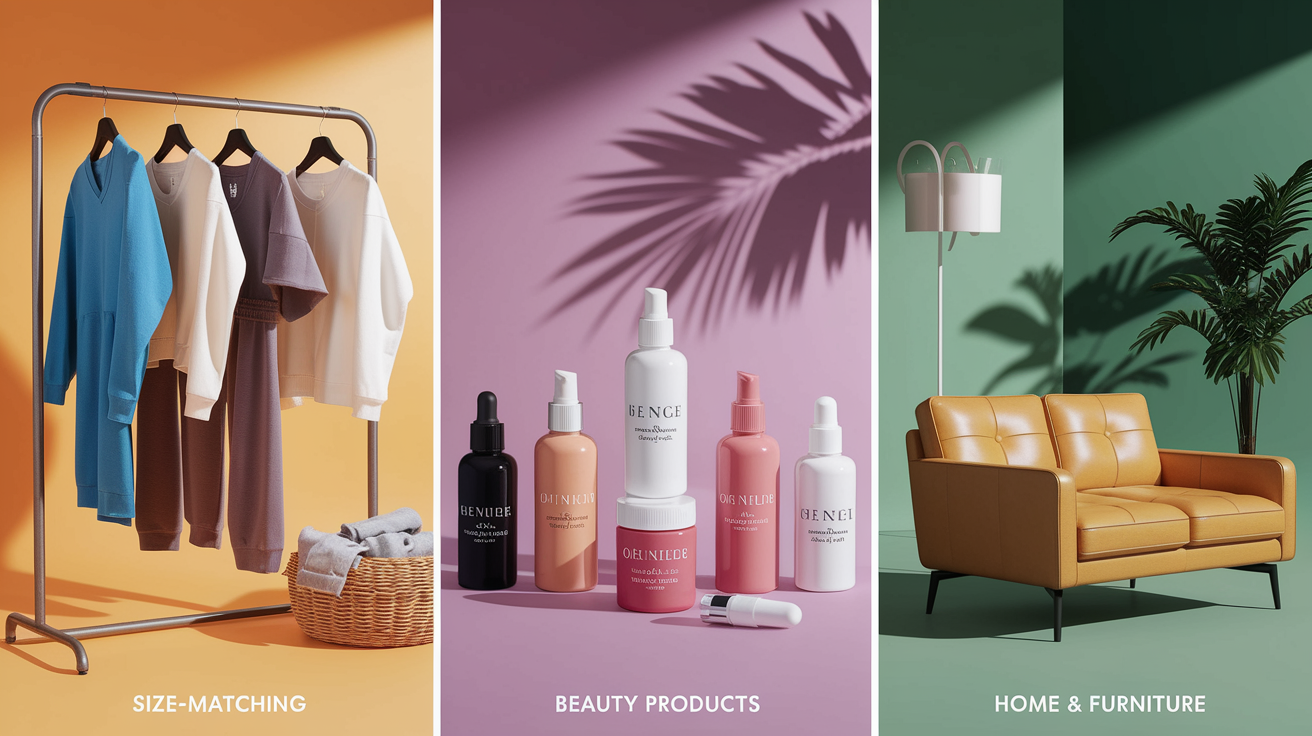
Personalization performance varies by product category and customer lifecycle stage. Apparel and footwear brands report AOV uplifts of 8% to 25% from personalization, driven by size-matching recommendations, style-based product carousels, and coordinated outfit suggestions. Beauty and cosmetics brands see revenue lifts of 15% to 35%, with particularly strong results from personalized product bundles, shade-matching tools, and subscription personalization. Home and furniture brands, operating with longer consideration cycles and higher AOVs, achieve 12% to 30% AOV improvements through predictive intent signals and complementary product recommendations, though baseline conversion rates remain lower due to purchase complexity.
Returning customers respond significantly more strongly to personalization than new visitors. Personalized offers, product recommendations, and content tailored to returning customers produce 10% to 25% higher conversion lifts compared to first-time visitor personalization. This gap reflects the richer behavioral and preference data available for repeat visitors, enabling more precise targeting and contextually relevant experiences. Brands that implement different personalization strategies for new versus returning visitors outperform those applying a single personalization approach across all visitor types. Discovery-focused recommendations for new visitors. Replenishment or cross-category upsell for returning customers.
New visitor personalization focuses on preference capture, friction reduction, and trust-building, with conversion lifts typically 8% to 15%. Returning visitor personalization, using purchase history and engagement patterns, delivers conversion improvements of 15% to 30% and AOV gains of 12% to 35%. The strategic implication is clear. Personalization systems must differentiate treatment based on customer lifecycle stage, not just product affinity.
Category-Specific Personalization Lift Highlights:
- Apparel & Footwear: AOV +8% to +25%. Strong performance from size-matching and style-based recommendations.
- Beauty & Cosmetics: Revenue lift +15% to +35%. High impact from personalized bundles and shade/skin-type matching.
- Home & Furniture: AOV +12% to +30%. Longer cycles require predictive intent and complementary product logic.
- Returning Customers vs New Visitors: Returning customers show +10% to +25% stronger personalization lift due to richer behavioral data.
AI Personalization & Recommendation Engine Accuracy Benchmarks

AI adoption in DTC personalization reached 55% to 65% penetration in 2026, with 89% of retailers actively using or piloting AI-driven personalization technologies. The performance gap between AI-assisted and traditional rule-based personalization is measurable. AI-engaged visitors convert at 12.3%, compared to 3.1% for shoppers navigating without AI assistance. A 4x difference. Hybrid personalization models that combine behavioral signals with demographic or contextual data deliver 10% to 25% incremental lift over simple segment-based personalization, reflecting the value of multi-signal decisioning.
Recommendation engine accuracy is typically measured through precision (the percentage of recommended items that are relevant) and recall (the percentage of relevant items that are recommended). High-performing DTC recommendation engines achieve precision rates of 25% to 40% and recall rates of 15% to 30%, though exact benchmarks depend on catalog size, click-through definitions, and training-data quality. Click-through rates on AI-generated recommendations range from 5% to 12%, with conversion rates on clicked recommendations between 8% and 18%. Model performance degrades when training data is stale or sparse, making continuous retraining and sufficient interaction volume critical to maintaining accuracy.
AI Personalization Adoption and Accuracy KPIs:
- AI Adoption Rate (2026): 55% to 65% of DTC brands use AI-driven personalization. 89% of retailers are deploying or assessing AI tools.
- AI-Engaged Visitor Conversion: 12.3% vs 3.1% baseline self-serve conversion (4x lift).
- Recommendation Engine Precision: 25% to 40% (percentage of recommended items that are relevant).
- Recommendation Engine Recall: 15% to 30% (percentage of relevant items successfully recommended).
- Hybrid Model Lift: +10% to +25% incremental performance vs static segment-based personalization.
Technical Performance Benchmarks: Latency, Model Training, and API Throughput
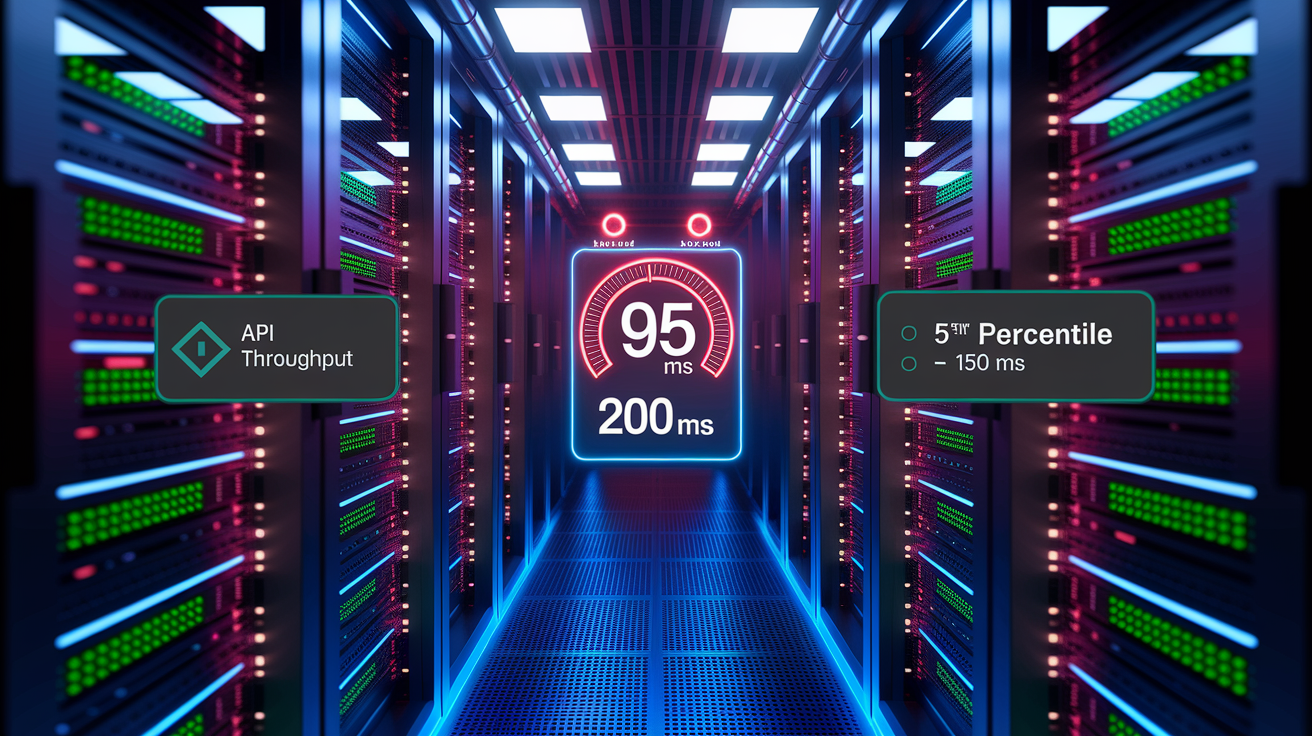
Real-time personalization systems must deliver recommendations, dynamic content, and AI-generated responses within 200 milliseconds or less to avoid degrading user experience. Latency above 200ms introduces perceptible lag, particularly on mobile devices, and can erode conversion gains. Brands operating headless commerce architectures or API-driven personalization stacks prioritize API response times under 150ms at the 95th percentile to ensure consistent performance during traffic spikes and peak shopping periods.
Model training timelines vary based on catalog size, interaction volume, and algorithm complexity. Small to mid-size DTC catalogs (500 to 5,000 SKUs) can retrain recommendation models daily or weekly with training cycles completing in hours. Large catalogs (10,000+ SKUs) or complex multi-objective models (optimizing for conversion, margin, and inventory simultaneously) may require overnight batch training or continuous online learning approaches. The 2026 norm is weekly or real-time model updates to maintain relevance as inventory, pricing, and shopper behavior shift.
Personalization Experimentation & Measurement Benchmarks for 2026

Structured experimentation is the standard for validating personalization impact in 2026. Holdout groups typically represent 10% to 20% of traffic, providing a control baseline for measuring incremental lift. Visitors or customer segments excluded from personalization. Statistical significance thresholds are set at 95% confidence, with minimum detectable effects of 3% to 5% for conversion and 5% to 10% for revenue, depending on traffic volume and test duration. Sample-size planning tools calculate required exposure based on baseline conversion, expected lift, and desired confidence. Typical DTC personalization tests require 5,000 to 50,000 visitors per variant to reach significance within two to four weeks.
Attribution windows for onsite personalization range from 30 to 90 days, capturing the majority of directly influenced purchases. Retention and lifecycle personalization impacts are measured over 90 to 180 days to account for repeat purchase cycles and longer customer journeys. Multi-touch attribution models are used by 40% to 60% of mid-market and enterprise DTC brands, though last-click and first-click models remain common for simplicity. Assigning fractional credit to each personalized touchpoint.
Continuous testing cadence is a hallmark of top-performing personalization programs. Leading DTC brands run 3 to 8 concurrent personalization experiments at any given time, iterating on recommendation algorithms, email flow timing, segment definitions, and dynamic content rules. The testing discipline separates high-performing programs from stagnant ones. Personalization performance compounds through incremental optimization, not one-time deployment.
| Test Component | Benchmark Standard |
|---|---|
| Holdout Group Size | 10% to 20% of traffic |
| Statistical Significance Threshold | 95% confidence; 3% to 5% MDE for conversion |
| Attribution Window (Onsite) | 30 to 90 days |
| Attribution Window (Retention/Lifecycle) | 90 to 180 days |
Investment, ROI & Team Benchmarks for Personalization in 2026

Return on investment timelines for personalization range from 3 to 9 months, with simpler tactics like email flow automation and onsite recommendation widgets reaching positive ROI within 3 to 4 months, while full-site dynamic personalization and AI orchestration platforms require 6 to 9 months. Median ROI across all personalization investments is 3x to 12x over twelve months, measured as incremental revenue divided by total cost of ownership. Platform fees, integration, content production, and internal labor.
Annual personalization technology spending varies by brand size. Small DTC brands (sub-$5M revenue) spend $10,000 to $60,000 per year on core personalization tools, typically SaaS recommendation widgets and email platform add-ons. Mid-market brands ($5M to $50M revenue) allocate $60,000 to $300,000 annually, covering more sophisticated platforms, data integration, experimentation tools, and external agency or consulting support. Enterprise brands (above $50M revenue) invest $300,000 to over $1 million per year, funding custom AI models, real-time orchestration platforms, dedicated data engineering, and full-time personalization product managers.
Marketing budget allocation to personalization technology and related services typically ranges from 8% to 15% for mid-market DTC brands, with top-performing brands skewing toward the higher end. This allocation includes platform subscriptions, data infrastructure, creative production for personalized content, and internal or external labor. Team headcount norms vary by scale. Small brands rely on 0.5 to 2 FTEs (often shared roles or external contractors). Mid-market brands staff 2 to 6 FTEs across growth marketing, CRM, data analytics, and content operations. Enterprise brands deploy 6 to 15+ FTEs, including dedicated data scientists, personalization product managers, email/lifecycle marketers, and content specialists.
Personalization Investment and Resourcing Benchmarks:
- ROI Timeline: 3 to 9 months to positive ROI. Median 12-month ROI 3x to 12x.
- Annual Technology Spend (Small Brands): $10,000 to $60,000.
- Annual Technology Spend (Mid-Market): $60,000 to $300,000.
- Annual Technology Spend (Enterprise): $300,000 to $1,000,000+.
- Team Headcount (Mid-Market): 2 to 6 FTEs across growth, CRM, analytics, and content.
Final Words
We ran through the concrete 2026 personalization numbers: onsite recommendations (+12-30% CVR), AOV lifts (+10-30%), email CTRs (+20-45%), AI-driven visitors converting ~12.3% vs 3.1% baseline, and retention/CLTV gains.
Compare how much traffic you expose, test with 10-20% holdouts, and track per-email revenue, AOV, and repeat purchases. Those are the levers.
Use these 2026 ecommerce personalization benchmarks for DTC brands as a quick scorecard. Start with one focused test this week and iterate. Small wins compound.
FAQ
Q: What are the core 2026 personalization benchmarks DTC brands must track?
A: The core 2026 personalization benchmarks DTC brands must track are onsite conversion lift +12–30%, AOV uplift +10–30%, email CTR +20–45%, AI-engaged conversion 12.3% vs 3.1%, repeat purchases +8–20%, CLTV +15–40%.
Q: How much conversion lift should I expect by personalization touchpoint in 2026?
A: Conversion lift by touchpoint in 2026 typically runs: recommendations +12–30%, personalized search +10–35%, dynamic homepage +8–20%; AI-engaged visitors convert at 12.3% versus a 3.1% baseline. Test each touchpoint.
Q: What AOV and cross-sell lifts are typical after personalization?
A: Typical AOV and cross-sell lifts after personalization are AOV +10–30%, checkout cross-sell +8–20%, engaged recommendation sessions can multiply AOV; expect CLTV increases around +15–40%. Prioritize high-AOV tests.
Q: How does personalization affect retention and repeat purchase rates?
A: Personalization increases repeat purchase rates by about +8–20% and improves CLTV +15–40%. Subscription models with tailored retention can hit 4:1–7:1 LTV:CAC. Measure over 90–180 days for lifecycle impact.
Q: What are realistic email personalization benchmarks in 2026?
A: Realistic email personalization benchmarks are opens ~43%+ (flows up to 83.6%), CTR lift +20–45%, and flows delivering far higher revenue per recipient (≈$2.87 vs $0.18). Focus on automated flows first.
Q: What percent of site traffic should see personalized experiences in 2026?
A: Percent of site traffic exposed to personalization in 2026 commonly ranges 30–65% depending on data and tech. Start with high-intent pages and scale once models and latency are validated.
Q: How widely is AI used for personalization and what impact does it have?
A: AI adoption is about 55–65% among DTC brands; AI-engaged visitors convert at 12.3% versus a 3.1% baseline. Hybrid behavioral-plus-demographic models add roughly +10–25% extra lift. Validate with holdouts.
Q: What technical performance targets should personalization systems meet?
A: Personalization systems should target under 200ms real-time latency, expect model training to take days for large catalogs, and maintain consistent API throughput to avoid site slowdowns. Monitor latency and errors.
Q: What testing and holdout standards should brands use for personalization experiments?
A: For personalization experiments use 10–20% holdouts, 95% significance, and 30–90 day attribution windows for onsite effects (90–180 days for retention). Size samples to detect the expected lift.
Q: How long until personalization pays off and how much should brands budget?
A: Personalization ROI typically appears in 3–9 months. Annual spend ranges $10k–$1M+ by brand size, and teams commonly run 0.5–15 FTEs. Start with high-impact flows and measurable tests.